The E3ME-FTT model
Short overview
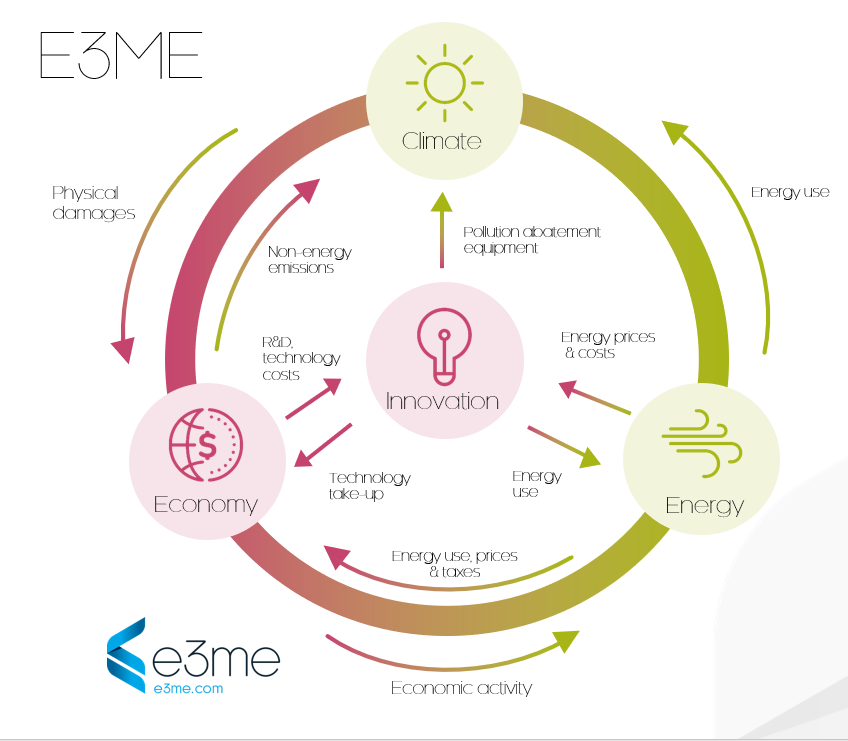
E3ME (https://www.e3me.com/) is a macro-econometric model with substantial sectoral detail at the Member State level, which captures interlinkages between the energy, economic and environmental systems. E3ME was originally developed through the European Framework Programme and has since been enhanced to become one of the key tools available for Impact Assessment in the EU. Because of its existing capability and geographical coverage (61 regions including the EU27+UK at the national level), E3ME is well-placed to assess the potential positive and negative impacts of a wide range of policies in the European Union and beyond.
E3ME’s core post-Keynesian economic framework has been expanded to include bottom-up models of technology diffusion in the energy sector (power, road transport, and heating system in buildings). These detailed, bottom-up, technology diffusion sub-modules are based on the Future Technology Transformation (FTT) methodology developed by Jean-Francois Mercure. For instance, FTT: Power uses a behavioural approach to determine the power mix that will generate electricity as its decision-making core mimics investors wanting to build new electrical capacity. The diffusion model makes decisions based on final energy demand and constrained by a global database of renewable and non-renewable resources. The choice of technology used depends partly on costs but also on how well the technology is already established. The other FTT models cover passenger transport, household heating and the steel sector.
Key features of the E3ME-FTT model
- As a global E3 model, E3ME can provide comprehensive analysis of policies:
- • direct impacts, for example reduction in energy demand and emissions, fuel
switching and renewable energy;
- • rebound effects of energy and materials consumption from lower price, spending on
energy or higher economic activities;
- • overall macroeconomic impacts; on jobs and economy including income distribution
at macro and sectoral level.
-
Summary of key strengths:
- • The close integration of the economy, energy systems and the environment, with
two-way linkages between each component;
- • The detailed sectoral disaggregation in the model’s classifications, allowing for
the analysis of similarly detailed scenarios;
- • Its global coverage, while still allowing for analysis at the national level for
large economies (61 regions total);
- • The econometric approach, which provides a strong empirical basis for the model and
means it is not reliant on some of the restrictive assumptions common to CGE
models;
- • The econometric specification of the model, making it suitable for short and
medium-term assessment, as well as longer-term trends.
Climate module & emissions granularity
E3ME covers fourteen types of air-borne emission (where data are available), including the six GHGs monitored under the Kyoto protocol. This in essence includes carbon dioxide (CO2) , methane (CH4), nitrous oxide (N2O) and F-gases; land-use CO2 (exogenously); and particulate matter (BC, OC, PM2.5), sulphur oxides (SOx), other nitrogen oxides (NOx) and organic compounds (OC/VOC).
Socioeconomic dimensions
-
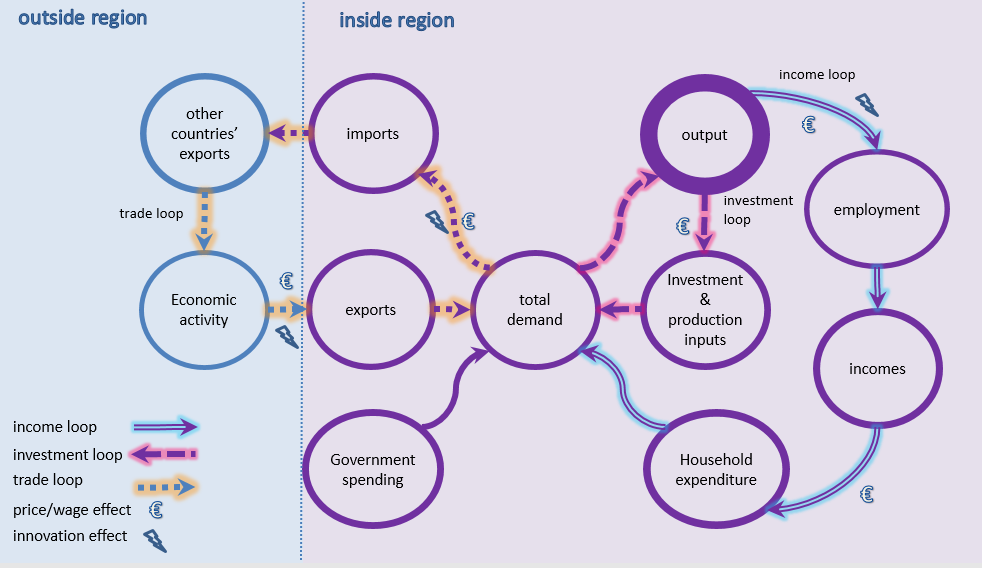
E3ME's economic module is shown in the below figure and is solved for each region. Most
of the economic variables shown in the chart are solved at the sectoral level. The whole
system is solved simultaneously for all industries and all regions, although
single-country solutions are also possible. As the figure suggests, output and
employment are determined by levels of demand, unless there are constraints on
available supply. The figure shows three loops or circuits of economic interdependence,
which are described below. In addition there is an interdependency between the sectors
that is not shown in the figure. The full set of loops comprises:
- • Interdependency between sectors: If one sector increases output it will buy more
inputs from its suppliers who will in turn purchase from their own suppliers. This
is similar to a Type I multiplier.
- • The income loop: If a sector increases output it may also increase employment,
leading to higher incomes and additional consumer spending. This in turn feeds back
into the economy, as given by a Type II multiplier.
- • The investment loop: When firms increase output (and expect higher levels of future
output) they must also increase production capacity by investing. This creates demand
for the production of the sectors that produce investment goods (e.g. construction,
engineering) and their supply chains.
- • The trade loop: Some of the increase in demand described above will be met by
imported goods and services. This leads to higher demand and production levels in
other countries. Hence there is also a loop between countries.
-
Policy assessments, including Impact Assessment at European level requires an analysis of
economic, social and environmental impacts. In quantitative modelling, the assessment of
social impacts is often largely ignored. This is partly due to a lack of quantitative
indicators but also that it often does not fit well into the basic structure of most
macroeconomic models. Like other models, E3ME is able to provide less coverage of social
factors than economic factors (see above) and environmental impacts but social factors are
not ignored completely. The main social indicators in the model are:
- • sectoral employment and working hours;
- • sectoral wage rates;
- • unemployment; and
- • an estimate of (real) income distribution.
Mitigation/adaptation measures and technologies
E3ME is often used to assess the impacts of climate mitigation policy on the economy and the labour market. The basic model structure links the economy to the energy system to ensure consistency across each area.
-
Possible policies to assess include:
- • Carbon and energy taxes;
- • Emission trading systems;
- • Environmental tax reforms;
- • Energy efficiency programmes;
- • Subsidies for particular technologies in the power, transport and residential
sectors;
- • Phase-outs of particular fuels and other direct regulation; and
- • Resource efficiency programmes.
-
Technological progress plays an important role in the E3ME model, affecting all three E’s:
economy, energy and environment:
- • The model’s endogenous technical progress indicators (TPIs), a function of R&D and
gross investment, appear in nine of E3ME’s econometric equation sets including trade,
the labour market and prices.
- • Investment and R&D in new technologies also appears in the E3ME’s energy and
material demand equations to capture energy/resource savings technologies as well
as pollution abatement equipment.
- • In addition, E3ME also captures low carbon technologies in the power, road
transport, heating, and iron and steel sectors through the FTT (Future Technology
Transformations) sector models._x000B_
Economic rationale and model solution
Economic activity undertaken by persons, households, firms and other groups in society has effects on other groups after a time lag, and the effects persist into future generations, although many of the effects soon become so small as to be negligible. But there are many actors and the effects, both beneficial and damaging, accumulate in economic and physical stocks. The effects are transmitted through the environment (with externalities such as greenhouse gas emissions contributing to global warming), through the economy and the price and money system (via the markets for labour and commodities), and through the global transport and information networks. The markets transmit effects in three main ways: through the level of activity creating demand for inputs of materials, fuels and labour; through wages and prices affecting incomes; and through incomes leading in turn to further demands for goods and services. These interdependencies suggest that an E3 model should be comprehensive and include many linkages between different parts of the economic and energy systems.
E3ME is often compared to Computable General Equilibrium (CGE) models. In many ways the modelling approaches are similar; they are used to answer similar questions and use similar inputs and outputs. However, underlying this there are important theoretical differences between the modelling approaches. In a typical CGE framework, optimal behaviour is assumed, output is determined by supply-side constraints and prices adjust fully so that all the available capacity is used.
In E3ME the determination of output comes from a post-Keynesian framework and it is possible to have spare capacity. The model is more demand-driven and it is not assumed that prices always adjust to market clearing levels. The differences have important practical implications, as they mean that in E3ME regulation and other policy may lead to increases in output if they are able to draw upon spare economic capacity. This is described in more detail in the model manual. The econometric specification of E3ME gives the model a strong empirical grounding. E3ME uses a system of error correction, allowing short-term dynamic (or transition) outcomes, moving towards a long-term trend. The dynamic specification is important when considering short and medium-term analysis (e.g. up to 2020) and rebound effects, which are included as standard in the model’s results.
Key parameters
The structure of E3ME is based on the system of national accounts, with further linkages to energy demand and environmental emissions. The labour market is also covered in detail, including both voluntary and involuntary unemployment. In total there are 33 sets of econometrically estimated equations, also including the components of GDP (consumption, investment, international trade), prices, energy demand and materials demand. Each equation set is disaggregated by country and by sector.
E3ME’s historical database covers the period 1970-2018 and the model projects forward annually to 2050. The main data sources for European countries are Eurostat and the IEA, supplemented by the OECD’s STAN database and other sources where appropriate. For regions outside Europe, additional sources for data include the UN, OECD, World Bank, IMF, ILO and national statistics. Gaps in the data are estimated using customised software algorithms.
-
The main dimensions of E3ME are:
- • 61 countries – all major world economies, the EU27+UK and candidate countries plus other countries’ economies grouped;
- • 44 (or 70 in Europe) industry sectors, based on standard international classifications;
- • 28 (or 43 in Europe) categories of household expenditure;
- • 22 different users of 12 different fuel types;
- • 14 types of air-borne emission (where data are available) including the 6 GHG’s monitored under the Kyoto Protocol.
Policy questions and SDGs
Key policies that can be addressed
-
Energy and Climate
- • Decarbonisation;
- • emission trading scheme/ carbon market;
- • carbon/energy targets;
- • carbon/ energy tax;
- • environmental tax reform;
- • renewables energy;
- • power generation mix;
- • green jobs;
- • CDM;
- • removal of harmful subsidies;
- • international energy prices.
-
Economic/Labour Market
- • fiscal policies: government revenues and spending;
- • monetary policies;
- • trade agreement;
- • labour supply and demand forecasts;
- • labour market policies e.g. improving female participation rate.
-
Others
- • sector specific studies e.g. aviation, water transport, engineering, chemical;
- • impacts of R&D and innovations;
- • resource efficiency.
Implications for other SDGs
The table below summarise how the E3ME model can be applied for selected SDG targets:
| SDG | Example of E3ME past or possible applications |
|---|---|
| SDG7: Affordable and Clean Energy |
|
| SDG8: Decent Work and Economic Growth |
|
| SDG12: Responsible Consumption and Production |
|
| SDG13: Climate Actions |
|
Recent use cases
| Paper DOI | Paper Title | Key findings |
|---|---|---|
| https://doi.org/10.1080/14693062.2019.1619507 | ‘Beyond peak emission transfers: historical impacts of globalization and future impacts of climate policies on international emission transfers’ | The authors find that emission transfers between OECD and non-OECD countries peaked in 2006, and have been declining since. The reversal is principally due to the reduction in the emissions intensity of traded goods, rather than the volume of trade. A more recent decline in embodied emissions transfers is also observed in trade between developing countries. Using E3ME to model a Nationally Determined Contribution scenario, the authors find that absolute embodied emissions are expected to plateau at current levels or slowly return to pre-2008- crisis levels , and differences between the NDC and baseline scenarios imply that NDC policies will not result in significant carbon leakage. |
| https://doi.org/10.1080/14693062.2019.1617665 | ‘Modelling innovation and the macroeconomics of low-carbon transitions: theory, perspectives and practical use’ | The authors traces the characteristic discrepancies in models’ outcomes to their origins in different macro-economic theories, most importantly their treatment of technological innovation and finance. The authors show that model outcomes are mainly determined by their representations of monetary and finance dimensions, and their interactions with investment, innovation and technological change. Improving these in all modelling approaches is crucial for strengthening the evidence base for policy making and gaining a more consistent picture of the macroeconomic impacts of achieving emissions reductions objectives. The paper contributes towards the ongoing effort of enhancing the transparency and understanding of sophisticated model mechanisms applied to energy and climate policy analysis. |
| https://doi.org/10.1016/j.ecolecon.2020.106631 | Uncertainties in macroeconomic assessments of low-carbon transition pathways – The case of the European iron and steel industry’ | The authors find that the effects of modelling zero-process emission pathway of the European iron and steel industry depend strongly on the technology choice, the prevailing macroeconomic states as well as regional characteristics. The underlying socioeconomic development and the climate policy trajectory, with a to date expected range of variation, seem to play a less important role. Particularly, the authors find that the choice of model, with its underlying macroeconomic theory, influences the sign and magnitude of macroeconomic effects and thus should be well understood by both modellers and policymakers. The paper argues that model assumptions should be transparent, results sought to be derived across a range of possible contexts, and presented together with the conditions under which they are valid. |
References
Pollitt, H., Neuhoff, K. and Lin, X. (2019) ‘The impact of implementing a consumption charge on carbon-intensive materials in Europe’, Climate Policy, in press.
Lehmann, P., Sijm, J., Gawel, E., Strunz, S., Chewpreecha, U., Mercure, J-F. and Pollitt, H (2018) ‘Addressing multiple externalities from electricity generation: a case for EU renewable energy policy beyond 2020?’, Environmental Economics and Policy Studies’, Volume 21, Issue 2, pp 255–283.
Mercure, J-F., Lam, A., Billington, S. and Pollitt, H. (2018) ‘Integrated assessment modelling as a positive science: private passenger road transport policies to meet a climate target well below 2°C’, Climatic Change, November 2018, Volume 151, Issue 2, pp 109–129
Knobloch, F., Pollitt H., Chewpreecha U., Daioglou V. and Mercure J-F. (2018) ‘Simulating the deep decarbonisation of residential heating for limiting global warming to 1.5°C’, Energy Efficiency, Volume 12, Issue 2, pp 521–550.
Holden, P.B., Edwards N.R., Ridgwell A., Wilkinson R.D., Fraedrich K., Lunkeit F., Pollitt H., Mercure J-F., Salas P., Lam A., Knobloch F., Chewpreecha U. and Viñuales J.E. (2018) ‘Climate–carbon cycle uncertainties and the Paris Agreement’, Nature Climate Change, Volume 8, pp 609-613 (2018).
Mercure, J-F., Pollitt, H., Viñuales, J.E., Edwards, N.R., Holden, P.B., Chewpreecha, U., Salas, P., Sognnaes, I., Lam, A. and Knobloch, F. (2018) ‘Macroeconomic impact of stranded fossil fuel assets’, Nature Climate Change, Volume 8, pp 588–593 (2018).
