The TIMES Integrated Assessment Model (TIAM)
Short overview
TIMES is a modelling platform for local, national or multi-regional energy systems, which provides a technology-rich basis for estimating how energy system operations will evolve over a long-term, multiple-period time horizon (Loulou and Labriet, 2007). These energy system operations include the extraction of primary energy such as fossil fuels, the conversion of this primary energy into useful forms (such as electricity, hydrogen, solid heating fuels and liquid transport fuels), and the use of these fuels in a range of energy service applications (vehicular transport, building heating and cooling, and the powering of industrial manufacturing plants). In multi-region versions of the model, fuel trading between regions is also estimated. The TIMES framework is usually applied to the analysis of the entire energy sector, but may also be applied to the detailed study of single sectors (e.g. the electricity and district heat sector). The framework can also be used to simulate the mitigation of non-CO2 greenhouse gases, including methane (CH4) and nitrous oxide (N2O).
The TIMES Integrate Assessment Model, TIAM, is the multi-region, global version of TIMES, which combines an energy system representation of fifteen different regions with options to mitigate non-CO2 greenhouse gases as well as non-energy CO2 mitigation options, such as afforestation in each of these regions. It uses emissions from these sources to calculate temperature changes using a simple climate module. As such, it can be used to explore a variety of questions on how to mitigate climate change through energy system and transformations, as well as reductions in non-energy CO2 emissions and non-CO2 emissions.
Key features of the TIAM model
Geographic coverage
The TIAM model covers the entire globe, via fifteen regions, as shown in the following table:
| Region ID | Geographic region | Countries |
|---|---|---|
| AFR | Africa | Algeria, Angola, Benin, Botswana, Cameroon, Congo, Democratic Republic of Congo, Côte d’Ivoire, Egypt, Eritrea, Ethiopia, Gabon, Ghana, Kenya, Libya, Morocco, Mozambique, Namibia, Nigeria, Senegal, South Africa, Sudan, United Republic of Tanzania, Togo, Tunisia, Zambia, Zimbabwe, and Other Africa |
| AUS | Oceania | Australia, New Zealand, Oceania |
| CAN | Canada | Canada |
| CHI | China | China |
| CSA | Central & South America | Argentina, Bolivia, Brazil, Chile, Colombia, Costa Rica, Cuba, Dominican Republic, Ecuador, El Salvador, Guatemala, Haiti, Honduras, Jamaica, Netherlands Antilles, Nicaragua, Panama, Paraguay, Peru, Trinidad and Tobago, Uruguay, Venezuela and Other Latin America |
| EEU | Eastern Europe | Albania, Bosnia-Herzegovina, Bulgaria, Croatia, Czech Republic, Hungary, Macedonia, Poland, Romania, Serbia and Montenegro, Slovenia, Slovakia |
| IND | India | India |
| JPN | Japan | Japan |
| MEA | Middle East | Bahrain, Islamic Republic of Iran, Iraq, Israel, Jordan, Kuwait, Lebanon, Oman, Qatar, Saudi Arabia, Syria, United Arab Emirates, Yemen, and Turkey, Cyprus |
| MEX | Mexico | Mexico |
| FSU | Russia and Central Asia | Armenia, Azerbaijan, Belarus, Estonia, Georgia, Kazakhstan, Kyrgyzstan, Latvia, Lithuania, Moldova, Tajikistan, Turkmenistan, Ukraine, Uzbekistan, Russian Federation |
| SKO | Republic of Korea | Republic of Korea |
| ODA | (Other) South and Southeast Asia | Bangladesh, Brunei Darussalam, Cambodia, Taiwan (China), Indonesia, DPR of Korea, Malaysia, Mongolia, Myanmar, Nepal, Pakistan, Philippines, Singapore, Sri Lanka, Thailand, Vietnam and Other Asia |
| USA | US | US |
| WEU | Western Europe | Austria, Belgium, Cyprus, Denmark, Finland, France, Germany, Greece, Iceland, Ireland, Italy, Luxembourg, Malta, Norway, Portugal, Spain, Sweden, Switzerland, The Netherlands, UK |
Energy system detail
TIAM is a technology-rich model; based on the TIMES energy system modelling framework, TIAM features a detailed representation of services and technologies in the energy sector (see the figure below).
Multi-year time periods
The time horizon over which TIAM simulates the evolution of the energy system is divided into a user-chosen number of time-periods. In the TIAM version to be used in PARIS REINFORCE, a starting period of 2005 is selected, with further periods including 2006-7, 2008-2015 (called 2012), and then ten-year periods of 2016-2025 (2020), 2026-2035 (2030), and so on, until 2096-2105 (2100). All years in a given period are considered to be identical. For all quantities such as installed technology levels, power plant capacities and energy and emission flows, any annual input quantity (e.g. coal used in a power plant per year) or output quantity (e.g. electricity generated from the coal plant per year) related to a given time period applies identically to each year in that period.
Intra-year time periods (time slices)
In addition to the multi-year time periods described above, in TIAM there are time divisions within a year, called “time slices”, which may be defined by the user, so as to capture different weather and energy demand conditions at different times of the year. Currently, there are six time-slices, representing summer daytime, summer night time, winter daytime, winter night time, and “transition season” day time and night time. Time slices are especially important whenever the mode and cost of production of an energy carrier at different times of the year are significantly different (Loulou and Labriet, 2007). For instance, when the demand for electricity fluctuates across the year and a variety of technologies may be chosen for its production at given times of the year (such as wind power when wind resources are high, and solar photovoltaics when there is a high availability of solar radiation). In such cases, the matching of supply and demand requires that the activities of the technologies producing and consuming the electricity be tracked—and matched—in each time slice.

Representation of the TIAM energy system for each region
Source: Authors, based on Loulou and Labriet (2007)
Climate module & emissions granularity
The climate module in TIAM uses emissions that are calculated within the model, as a result of the energy system’s operations, as well as any mitigation of non-energy CO2 and non-CO2 gases. The model tracks the three main sources of greenhouse gases - carbon dioxide (CO2), methane (CH4) and nitrous oxide (N2O). TIAM’s climate module calculates changes in the atmospheric concentration of CO2, CH4 and N2O, and as a consequence the change in atmospheric radiative forcing (which leads to global warming) compared to pre-industrial times, and finally the temperature change over pre-industrial times for the atmosphere and the deep ocean. The figure below gives a graphical overview of the module‘s structure.
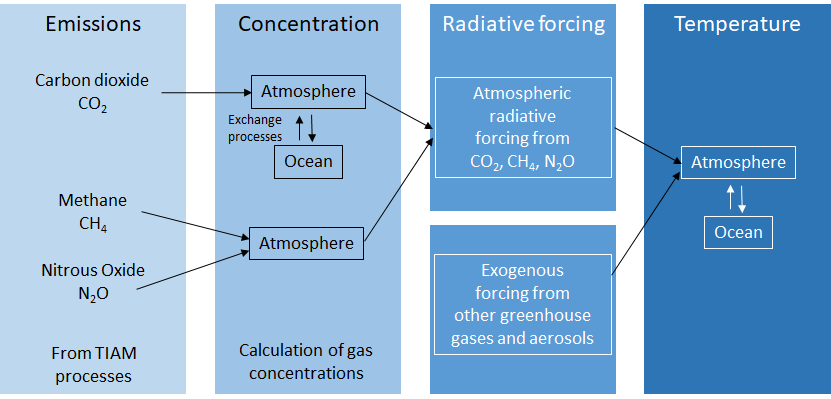
Logic of TIAM climate module
Source: https://iea-etsap.org/TIAM_f/TIAM%20description_slides.pdf
Socioeconomic dimensions
The TIAM model requires inputs concerning the degree to which energy demand, as well as demand for other goods and services which result in GHG emissions (such as agricultural demand) will grow over the course of the 21st century. This is achieved by using various socioeconomic inputs, as described in this section.
Economic growth
Economic growth is based on the Shared Socioeconomic Pathways variant 2 (SSP2), sometimes called the “middle-of-the-road” scenario as it generally follows recent past trends in demographic, social, economic and lifestyle developments (Fricko et al., 2017). TIAM specifically uses the OECD projections for SSP2. This results in a growth in world Gross Domestic Product to $540 trn in 2005$ Purchasing Power Parity terms, by 2100, compared to $100 trn in 2020 (Dellink et al., 2017).
Population growth
Population growth is also based on SSP2, with global population growing to around 9 billion by 2050 peaking at 9.5 billion in 2060 and dropping back to 9 billion by 2100 (KC and Lutz, 2017). The figure below shows the global population and GDP development paths in SSP2.


It should be noted that TIAM can be adjusted to use other socioeconomic growth projections apart from SSP2.
Sectoral growth
The growth in the industrial, agricultural and retail business sectors in each region is derived from the region’s overall GDP growth, with each sector’s share of total GDP changing over time. These shares are derived from a historical analysis of how all countries’ sectoral shares of output have changed as their overall output grew. Growth of residential households is derived from population growth and assumptions on average household size in each region.
Growth in each of these sectors drives energy demand as described in the next sub-section.
Energy demand drivers
The economic, population and sectoral growths are used to determine specific drivers for the growth in energy demands in a “reference” scenario where no climate change mitigation takes place. For example, the demand for the number of billion kilometer-vehicles (bvkm) travelled by automobiles is based on GDP per capita, whereas the growth in the demand for residential space heating is driven by the number of households.
Energy demand elasticities
Once the drivers for the different energy demands represented by TIAM are determined and quantified, the construction of the reference demand scenario requires computing a set of energy service demands over the horizon. This is done by choosing elasticities of demands to their respective drivers, in each region, using the following general formula:
Demand = Driver Elasticity
So, for example, the number of billion vehicle km travelled by automobiles, bvkm, grows by a factor which is the growth in the GDP per capita in a region to the power of a pre-defined elasticity:
bvkm = (GDP/capita)Elasticity
In most cases, the elasticities (which vary over time) are less than 1, and decrease over time. For example, an elasticity of 0.8 means that a 10% increase in the growth of GDP per capita in a region would result in an 8% increase in billions of vehicle kilometres driven. Over time this could reduce to a much smaller elasticity, reflecting empirical evidence that demand for energy services such as automobile transport ultimately saturates with rising incomes.
TIAM has the capability of estimating the price-based response of these energy service demands to the changing conditions of scenarios in which mitigation occurs. For example, if the cost of energy increases as fossil fuels are replaced by renewables, then the demand for energy services would decrease. To do this, TIAM uses another set of inputs, namely the price elasticities of the demands for each energy service considered. TIAM can then calculate the new demands for these mitigation cases.
Calibration of the model
The TIAM model is calibrated for the initial period (currently 2005) using IEA world energy statistics for the year 2005, with the projections for energy, installed technology capacity and emissions further calibrated to 2012. This is currently being updated, and the current intention is that, if this update is complete in sufficient time, the version of TIAM to be used in Paris Reinforce will have a full IEA energy statistics-based calibration to the year 2015. The main variables to be calibrated are: the capacities and operating levels of all technologies, the extracted, exported, imported, produced, and consumed quantities for all energy carriers, and the emissions if modelled.
Mitigation/adaptation measures and technologies
TIAM is a technology-rich model that represents most major fossil fuel and low-carbon technologies that are envisaged to be available for at least the first half of the 21st century. By simulating the substitution of low-carbon for high-carbon technologies in response to their relative costs, as well as emissions constraints and/or carbon prices, the TIAM model simulates mitigation. The principal energy sector CO2 mitigation technology options are as shown in the following table:
| Upstream | |
|---|---|
| Synthetic fuel production | Hydrogen production |
|
|
Electricity and heat |
|
| Electricity generation | Heat generation |
|
Biomass |
Transport |
|
| Road | Rail |
|
|
| Air | Marine |
|
|
Buildings |
|
| Heating | Lighting |
|
Efficiency |
| Appliances | Cooling |
| Efficiency |
Electricity Efficiency |
Industry |
|
| Process heat | Machine drives |
|
Gas replacing oil / coal Biomass Hydrogen Electricity |
Gas replacing oil / coal Electricity |
| Steam | CHP |
|
Gas replacing oil / coal Electricity |
Gas replacing oil / coal Biomass |
| CCS | Other |
|
CCS in iron and steel CCS in cement CCS in chemicals |
|
Agriculture |
|
| Energy | Other |
|
Biomass Electricity |
|
-
TIAM also contains a range of non-energy CO2 and non-CO2 mitigation options, albeit
in a relatively simplified form. For non-energy CO2, the key option is afforestation.
For methane (CH4), these options are:
- Farm scale digesters for manure.
- Anaerobic digestion, composting, heat production, electricity generation and flaring from landfill methane.
- Minimisation of methane leaks from fossil fuel extraction and distribution, and/or flaring of methane to (lower global warming potential) carbon dioxide gas.
-
For nitrous oxide (N2O) these options are:
- Thermal destruction of gas from adipic acid production
- Catalytic reduction of gas from nitric acid production
In addition to the above mitigation options, the TIAM model has recently been developed to simulate the deployment and operation of a range of advanced technologies, including Direct Air Capture for CO2 removal and sequestration (Realmonte et al., 2019) and even hyper-loop terrestrial high speed transport to substitute for some domestic aviation trips (Napp et al., 2019). In principle many other energy technologies could be simulated in the model.
Economic rationale and model solution
TIAM simultaneously calculates the quantity of production and consumption of the different “commodities” accounted for in the model. These commodities are the different energy forms, the different quantities of deployed technologies, and the different quantities of energy services. The price of producing a commodity affects the demand for that commodity, while at the same time the demand affects the commodity’s price. TIAM operates in a market-clearing manner, such that prices of commodities are consistent with the supply and demand being in balance for all commodities.

Basic rationale of TIAM equilibrium for commodity supply and demand balance
Source: https://iea-etsap.org/TIAM_f/TIAM%20description_slides.pdf
TIAM most commonly operates on a perfect foresight principle, such that it has knowledge of all current and future technology costs and fuel supply curves. This allows it to reach a cost-minimising level of commodity production and consumption, which is consistent with meeting all current and future energy demands, as well as any imposed emissions constraints. The total energy system cost (including any losses to consumers’ welfare as a result of energy price rises) is calculated as a Net Present Value (NPV) cost of the energy system over the whole time period until 2100. A “discount” factor of 5% per year is used to value the costs of the energy system at different time points in the future. In other words, a cost of $100 one year in the future would be equated to a cost of $95 today. This discount factor can be changed.
Key parameters
TIAM is a technology-rich tool where techno-economic information is assigned to each process (existing and future) of the system, and therefore many data/parameter values can be extracted and reported.
-
Key parameters to monitor, discuss and evaluate in the framework of the PARIS REINFORCE
project are likely to be:
- Fossil fuel availability and cost (i.e. supply curves) and expected production rates.
- Technology availability and costs.
- Information about under construction/planned/possible energy technologies.
- Regional emissions reduction goals.
- Energy efficiency improvements costs/limits (from the supply side to the demand side).
Parameters can be revised and updated in the framework of the PARIS REINFORCE project, following the feedback of experts (stakeholder engagement), the comparative assessment with other modelling experiences, and the discussion with the partners (modellers).
Policy questions and SDGs
Key policies that can be addressed
-
TIAM predominantly works by specifying either a carbon price (imposed as a tax) or a
carbon emissions constraint in each region that it represents, or alternatively all
regions simultaneously. For example, the following further policies can be implemented:
- Minimum / maximum capacity factors on fossil fuel power generation plants (e.g. to simulate minimum or maximum desired levels of operation);
- Subsidies on particular technologies (through adjusting their costs);
- Constraints on the availability of particular technologies (e.g. “no nuclear”, variable renewables accounting for no more than 50% of electricity generation);
- Constraints on the growth rates of particular technologies (e.g. carbon capture and storage power generation capacity cannot grow at more than 20% per year)
- Inter-regional emissions trading (or no trading);
-
This allows TIAM to perform a number of policy-relevant investigations, such as:
-
What are the energy system cost and energy technology and fuel mix implications
of imposing emissions or climate constraints earlier or later in the century, in
different regions at different times and to different levels of stringency?
- For example, Gambhir et al. (2017) explored the cost implications of introducing delays to mitigation from 2020 to 2030, using the TIAM model and two other integrated assessment models.
-
How are the above implications affected with and without emissions permit trading?
- For example, Gambhir et al. (2014) examined the cost and energy system transformation implications of India meeting a regional emissions reduction target by 2050, with and without international carbon permit trading, whilst Few et al. (2017) considered mitigation costs and feasibility with different shale gas cost and availability assumptions.
-
How are the above implications affected with different input assumptions on
socioeconomic growth, technological availability, technology costs, fossil fuel
costs and availability?
- For example, Gambhir et al. (2017) examined the mitigation costs of achieving a 2oC climate target with delayed introduction of carbon capture and storage so that it wasn’t available before 2050, whilst Realmonte et al. (2019) undertook a deep-dive into the energy system implications of using direct air capture technologies.
-
How are the above implications affected by imposed policies such as power plant
capacity factor constraints?
- For example, Napp et al. (2017) considered the feasibility of meeting a 2oC climate target on the assumption that coal plants would need to be kept running at considerable capacity factors for some years to come.
| SDG | Details |
|---|---|
| §3. Health (e.g., air-pollution related mortality) | The use of solid fuels in buildings can form the basis of local air pollution calculations. |
| §7. Affordable and clean energy | Cost-effectiveness and availability of low-carbon energy is a central set of TIAM outputs. |
| §8. Decent work & economic growth | TIAM reports energy system costs under different scenarios, often expressed as a share of GDP, giving a measure of economic losses due to mitigation. Note, this does not account for economic gains due to mitigation that result from lower temperature changes. |
| S9: Industry, innovation and infrastructure | Quantifies low-carbon energy technology deployments, investments and energy system costs. |
| §15: Life on land | Afforestation measures can be taken into account; RES potential/exploitation and investment decisions (e.g. energy infrastructures) can be subject to land-specific constraints (natural and regulatory). |
Model presentation
Video
Slides
Download slides in pdfRecent use cases
| SDG | Topic | Key findings |
|---|---|---|
| Realmonte et al. (2019) | An investigation of the role of Direct Air Capture (DAC) in meeting global 1.5oC and 2oC pathways | DAC can reduce the policy costs of mitigation in the near-term, but there are many uncertainties about its scale-up potential and, if we ease mitigation efforts and rely on DAC, even if it does not deliver large-scale removals, we will overshoot the Paris climate goals. |
| Napp et al. (2019) | Analysis of deep mitigation pathways with advanced mitigation technologies including hydrogen aviation, hydrogen in industrial manufacturing, and CCS across industry, and deep demand side reductions including modal shifts and other behaviour changes | Development and deployment of a range of advanced demand-side technologies, combined with demand-side energy savings as a result of behaviour change, could significantly ease the pressure on using negative emissions like bio-energy with carbon capture to meet the Paris goals. |
| Gambhir et al. (2017) | Establishing a set of metrics by which to assess the feasibility of achieving different climate targets | Using multiple metrics such as mitigation cost, carbon price, degree of asset stranding, quantity of negative emissions required and rates of energy efficiency improvement, it is significantly (>30%) cheaper and much more feasible to meet a 2oC target by starting globally coordinated mitigation action in 2020 compared to 2030. |
| Gambhir et al. (2017) | Analysis coupled with a separate non-CO2 and separate climate model to assess the contribution that non-CO2 mitigation can make to reaching deep mitigation targets | Attempting to meet any climate target without actively mitigating non-CO2 greenhouse gases would be much more expensive than using a multi-gas mitigation strategy. |
| Napp et al. (2017) | Analysis of the potential to meet deep mitigation targets with a variety of growth and other constraints on technology deployment, so that future technology transition rates do not exceed the fastest historical rates | If we cannot exceed historical patterns and rates of energy system transformation, then we will miss the 2oC target by about 0.1oC. Thus, we must implement policies to accelerate the transition beyond past rates. |
| Few et al., (2017) | Analysis of the costs of meeting 2oC climate targets with different assumptions on the cost and availability of shale gas in different world regions. | Exploitation of shale gas could make mitigation to 2oC marginally more expensive, but could also lead to some temperature target overshoot if fugitive methane emissions are not effectively regulated. |
| Chiodi et al. (2016) | Analysis of the medium- and long-term implications of increased development of unconventional gas and oil and their by-products on European market | Although in Europe natural gas can be considered as transition fuel towards a low-carbon economy, the natural gas market will expand in the future years and will contribute—replacing other more carbon intensive fossil fuels—to the decarbonisation of energy sectors. The EU-28 exploitation of unconventional oil will be very limited. |
References
Fricko, O., Havlik, P., Rogelj, J., Klimont, Z., Gusti, M., Johnson, N., ... & Ermolieva, T. (2017). The marker quantification of the Shared Socioeconomic Pathway 2: A middle-of-the-road scenario for the 21st century. Global Environmental Change, 42, 251-267.
Dellink, R., Chateau, J., Lanzi, E., & Magné, B. (2017). Long-term economic growth projections in the Shared Socioeconomic Pathways. Global Environmental Change, 42, 200-214.
Realmonte, G., Drouet, L., Gambhir, A., Glynn, J., Hawkes, A., Köberle, A. C., & Tavoni, M. (2019). An inter-model assessment of the role of direct air capture in deep mitigation pathways. Nature communications, 10(1), 3277.
Napp, T. A., Few, S., Sood, A., Bernie, D., Hawkes, A., & Gambhir, A. (2019). The role of advanced demand-sector technologies and energy demand reduction in achieving ambitious carbon budgets. Applied energy, 238, 351-367.
Gambhir, A., Drouet, L., McCollum, D., Napp, T., Bernie, D., Hawkes, A., ... & Lowe, J. (2017). Assessing the feasibility of global long-term mitigation scenarios. Energies, 10(1), 89.
Gambhir, A., Napp, T. A., Emmott, C. J., & Anandarajah, G. (2014). India's CO2 emissions pathways to 2050: Energy system, economic and fossil fuel impacts with and without carbon permit trading. Energy, 77, 791-801.
Few, S., Gambhir, A., Napp, T., Hawkes, A., Mangeon, S., Bernie, D., & Lowe, J. (2017). The impact of shale gas on the cost and feasibility of meeting climate targets—a global energy system model analysis and an exploration of uncertainties. Energies, 10(2), 158.
Chiodi, A., Gargiulo, M., Gracceva, F., De Miglio, R., Spisto, A., Costescu, A., & Giaccaria, S. (2016). Unconventional oil and gas resources in future energy markets - A modelling analysis of the economic impacts on global energy markets and implication for Europe. Publications Office of the European Union, Luxembourg. doi: 10.2790/83538.
