The 42 model
Short overview
42 is a simulation model for estimating CO2 emissions associated with energy consumption in a wide range of countries, dividing the world into 50 countries and regions. The key goal of the model is to describe the target characteristics of the perspective energy sector in different countries for their effective integration into the global process of regulating emissions. The model is used to calculate the impacts of possible structural changes, as well as of improvements in the efficiency of energy use. The energy sector of all countries is described in detail in the form of energy balances, synchronised with the methodology of the International Energy Agency (IEA). Modelling is based on a bottom-up approach: first, the final consumption of energy resources is estimated for the industrial, transport, residential, and services sectors; and then model calculates the necessary amount of primary energy resources needed to produce petroleum products, electricity and heat. Key influencing factors include changes in the fuel structure of electricity and heat production; changes in the efficiency of electricity and heat production based on different types of fuel; changes in the structure of vehicle fleet (for cars and trucks); changes in energy consumption per capita; and changes in energy efficiency in manufacturing sectors of the economy.
Key features of the 42 model
Geographic coverage
In the 42 model, the world is divided into 50 countries and regions, as shown in the following table:
| Regions | Geographic regions/countries covered in the model |
|---|---|
| North America | USA, Canada, Mexico |
| Central and South America | Argentina, Brazil, Columbia, Ecuador, Venezuela, Other Central and South America |
| Europe | EU, Norway, Iceland, Switzerland, Turkey, Other Europe |
| Commonwealth of Independent States | Russia, Azerbaijan, Belarus, Kazakhstan, Turkmenistan, Ukraine, Uzbekistan, Other countries |
| Africa | Angola, Algeria, Egypt, Gabon, Libya, Mozambique, Nigeria, South Africa, Other Africa |
| Middle East | UAE, Iran, Iraq, Kuwait, Qatar, Saudi Arabia, Other Middle East |
| Asia | Australia, China, India, Indonesia, Japan, South Korea, Malaysia, New Zeeland, Thailand, Vietnam, Other Asia |
Energy sectoral detail
The description of the energy sector is performed through energy balances synchronised with the methodology of the International Energy Agency and built on the basis of its data.
Primary energy resources include coal, natural gas, oil, nuclear, hydro, solar, wind, biofuels, and other renewables; while secondary energy resources include electricity, heat, oil products (gasoline, diesel, fuel oil, jet fuel, naphtha and LPG, and others).
The structure of the energy consumption balance is quite typical, although there is particular aggregation in the final consumption unit. The model also distinguishes energy consumption for bunkering. Road transport is divided into cars and trucks.
| Transformation | Final Consumption | Total Primary Energy Supply |
|---|---|---|
| Power sector | Industry | Bunkers |
| Heating | Aviation | |
| Oil refineries | Road transport (cars and trucks) | |
| Coal transformation | Rail transport | |
| Gas works | Other transport | |
| Liquefaction | Residential | |
| Other transformation | Commercial and public services | |
| Loses, Energy industry own use | Non-energy use in chemical | |
| Other non-energy use |
Time coverage
The forecast period is until 2045, while energy balances of all countries are built for each year (i.e. one-year time steps).
Emissions granularity
42 does not have a climate module and does not calculate the impact of anthropogenic emissions on climate change. The current version of the model tracks only carbon dioxide (CO2) emissions. It may be expanded during the implementation of the PARIS REINFORCE project, in order to provide a more complete description of anthropogenic emissions.
Socioeconomic dimensions
42 requires a number of socioeconomic metrics, according to which both energy consumption and energy-related CO2 emissions are modelled. The key parameters concern economic growth and its structure, population, vehicle fleet and energy intensity for each country/region under consideration. The current version of the 42 model contains relevant and representative data for all of these dimensions.
Population growth
Population growth is one of the primary causes of world energy consumption increase. The UN demographic forecast is usually employed as a basis for population scenarios. The reference (medium) scenario assumes an increase in the global population to 9.5 billion by 2045 (average annual growth rate of 0.7%). 42 does not consider population structure (e.g. by age group, urbanisation status, etc.).
Economic growth
Another driver for increasing energy consumption is economic growth. Currently, scenario hypotheses on the GDP growth rates for all the countries and regions under consideration are set in accordance with calculations on economic forecasting models performed by the team of the Institute of Economic Forecasting of the Russian Academy of Sciences. According to these estimates, global GDP will increase 2.45 times, from 110 (currently) to 270 trillion dollars (2011 PPP) by 2045. However, 42 can use any hypotheses on GDP growth as inputs.
The structure of GDP is also an important metric, since different sectors are characterised by various levels of energy intensity. The 42 model distinguishes the following components of the total value added in the economy of all countries/regions: material production, transport, and services. The ratio of these segments is analysed basing on an econometric approach.
Vehicle fleet
Road transport is an important energy consumer, providing about 40% of global oil demand. The vehicle fleet size reflects the economic situation: the growth of household income stimulates the purchase of a private vehicle, and economic development creates a cargo flow for transportation. Further development of the world economy is associated with an increase of the fleet size. The reference scenario for the car fleet in Russia is defined as population times the automobilisation rate. At the same time, the automobilisation rate depends on GDP per capita (the relationship between these parameters is described by an S-shaped curve, which is similar to consumer demand saturation). However, its future dynamics can be significantly transformed. The modern generation of young people is less interested in buying a personal car, and new technologies make a sharing-based model of transportation affordable and convenient. The development of online services and remote work can also reduce the demand for mobility. Given these factors, transportation and fleet forecasts vary widely.
Nowadays, the most crucial trend is government incentives to change the structure of the automotive market in the direction of low-carbon solutions (electric vehicles). Therefore, structural shifts in the fleet constitute another key socioeconomic metric for future energy consumption. Simulating the growth of the share of low-carbon transport is a way of modelling climate change mitigation.
Energy intensity of the economy
Economic and demographic development provide gross characteristics of energy demand. However, energy efficiency is superimposed on these, slowing the increase of global consumption and CO2 emissions. In the 42 model, there is no relationship between the investment process and energy efficiency. Instead, energy intensities of different industries are inputs to the model.
The logarithmic approximation is used as typical dynamics of energy intensity curves in different industries. It is characterised by damping dynamics and is well suited to describe the logic of energy consumption process evolution. The growing logarithmic curve produces a situation of increasing consumption, as it implies that the role of an energy resource is strengthened in a specific economic sector (for instance, electrification of residences and services; increase in electric equipment in industries of developing countries; spread of carbon-free resources in developed countries). The falling logarithmic curve produces situations either of improving the efficiency or of consumers moving away from a particular energy source (for instance, a replacement of coal).
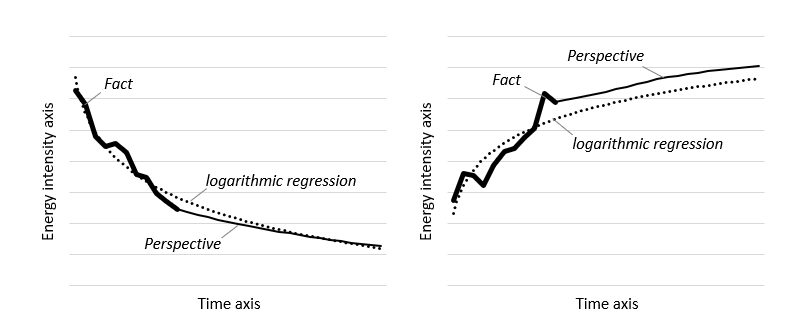
Typical dynamics of energy intensity curves in the 42 Model
Calibration of the model
The 42 model is calibrated to IEA’s energy balances for the period of 1990-2016, for each of the countries/regions considered.
Mitigation/adaptation measures and technologies
42 is a simulation model focused on the implementation of low-carbon solutions in the field of electricity and heat production, and automobile transport. By simulating the substitution of low-carbon for high-carbon technologies, the 42 model simulates mitigation. The principal energy-sector CO2 mitigation technology options are as shown in the table below. Particular attention is paid to improving the efficiency of energy consumption through the simulation of energy intensity curves.
| Electricity generation | Heat generation |
|
Efficiency Nuclear Hydro Biomass Solar Wind |
Efficiency Geothermal Biomass |
| Road transport | Other transport |
|
Efficiency Gas vehicles Electric vehicles |
Gas Electric Efficiency |
| Industry | Residential |
|
Gas replacing oil / coal Electricity Biomass Efficiency |
Efficiency Electrification Gasification |
Economic rationale and model solution
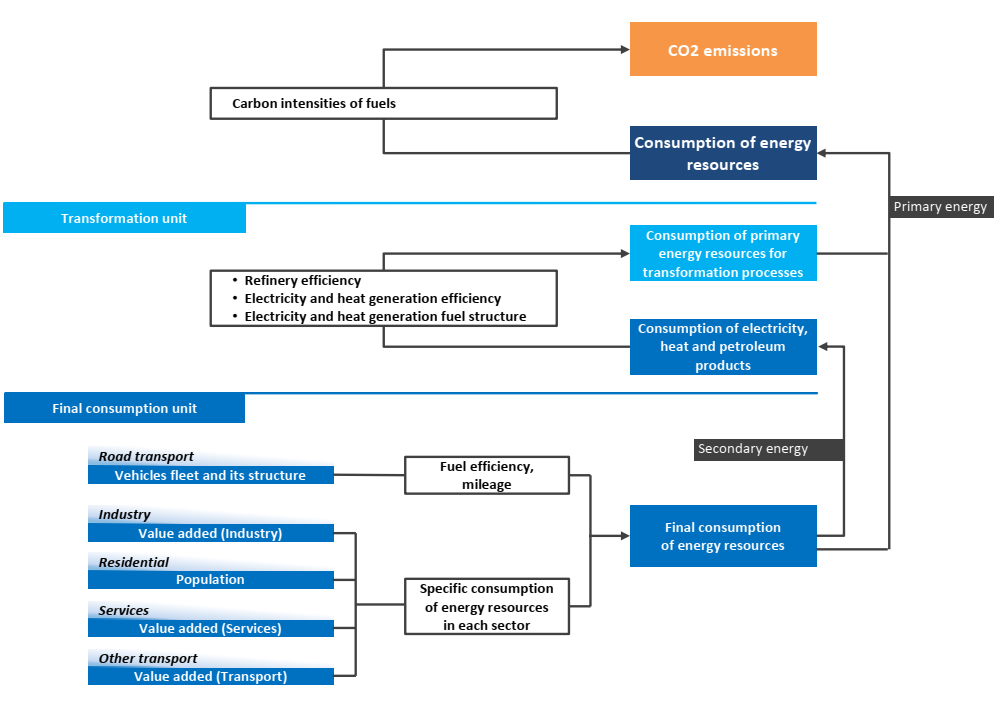
Modelling is based on a bottom-up approach: first, the final consumption of energy resources is estimated for industry, transport, the residential sector, and services; and then the model calculates the necessary amount of primary energy resources needed to produce petroleum products, electricity and heat. The amount of primary energy consumption in these two phases explains the total energy consumption, which is multiplied by the carbon intensity vector and thus CO2 emissions associated with the energy sector are calculated.
The process of energy consumption is modelled as a combination of three classes of influencing factors:
Consumption = Gross factor * Structural factor * Technological factor
-
Gross factor characterises the size of an object consuming energy. The examples of such
factors distinguished are as follows:
- GDP (gross factor for the entire economy)
- population (gross factor for residential sector)
- vehicle fleet (gross factor of transport sector)
- electricity production (gross factor of power sector)
-
The structural factor is necessary in order to identify which part of the “gross” object
consumes a particular energy product. The following structural factors are distinguished:
- GDP structure (shares of value added in material production, transport and services in relation to GDP)
- electricity production structure (it determines how much electricity will be generated on the basis of different types of energy resources)
- vehicle fleet structure (it shows how many cars will consume different types of motor fuels)
-
The technological factor is necessary in order to describe the dynamics of
specific energy consumption. For example, how much natural gas is needed to produce 1 kWh
of electricity; how many litres of diesel are needed to drive 100 km by car; how much
energy is needed to create 1 million USD of value added in the services. The following
technological factors are distinguished:
- vehicle fuel efficiency per 100 km
- efficiencies of power generation technologies
- energy intensity of value added in different s
Using all these key drivers of future energy demand as model inputs, the 42 is focused on energy-associated CO2 emissions calculation according to a simulation-based approach.
Solution algorithm for the 42 model
Key parameters
-
Model 42 offers a simulation-based description of energy consumption processes. Therefore,
in addition to socioeconomic and demographic characteristics, it requires parameters of
CO2 mitigation measures in terms of structural and technological features of the energy
sector. A list of key parameters for all countries under consideration is given below:
- vehicle fleet and its structure (depending on the people’s mobility hypothesis);
- structure of electricity and heat production (may be based on the countries’ goals within the framework of the Paris Agreement or more ambitious targets);
- energy intensities of different sectors;
- fuel efficiency for cars and trucks (may be based on countries technical regulation of automotive industry and markets); and
- fuel efficiency for electricity and heat plants.
These parameters should be set to take into account existing goals of the national climate policy implemented by the countries under consideration, as well as to define the most efficient structure of the energy sector that is in line with the goals of the selected level of climate change mitigation (be that the Paris Agreement goals or scenarios of increased ambition).
Policy questions and SDGs
Key policies that can be addressed
-
As a simulation model, 42 predominantly works by adjusting the structural characteristic
and efficiency parameters of energy-consuming sectors. In addition, the emission limits
being adopted by countries may be used as a simulation target. The following policies
can be implemented during the calculations:
- goals for renewable energy-based electricity generation in benchmark years;
- restrictions of the capacities/production for the power plants based on the fossil fuels;
- restriction or complete ban on sale and use of conventional (internal combustion engine) cars;
- stimulation of energy efficiency in terms of decreasing energy intensities of value added and energy consumption per capita; and
- restriction of CO2 emissions associated with energy consumption.
42 may help to implement policy-relevant investigations, focused on searching the objective parameters, which are consistent with a low-carbon future, of national energy sectors of a wide list of countries. The overarching question the model aims to address is: what is the structure of the energy balance, in consistency with the Paris Agreement?
Implications for other SDGs
As an energy model, 42 is able track the goals for SDG §7 (affordable and clean energy), by exploring for example the share of low-carbon energy in the power sector and fuels in transportation.
Recent use cases
| Paper | Topic | Key findings |
|---|---|---|
| Ivanter et al. (2018) | Boosting the development of the Russian economy: priority actions (suggestions for the main activities of the State until 2024) | The report highlights priority directions of the economic policy, primarily in investment activity, development of the domestic market, as well as financial and organisational support for the suggested actions. 42 was used to determine the potential scenarios of future demand for Russian energy resources in the world |
| Semikashev et al. (2016) | Analysis and forecast of prospects for renewable energy development in the world until 2030 | The goals of the countries under the Paris Agreement are studied. The structure of global energy consumption while achieving all stated goals is shown. The role of renewable energy in the global energy sector is assessed. |
| Uzyakov et al. (2016) | Integrated approach to the construction of agreed scenarios of world oil production, consumption and price | The article describes the evolution of the pricing mechanisms in the world oil market. We demonstrate the practical use of a modelling ensemble (which includes the 42 model) on the example of construction of agreed world oil production, consumption and price scenarios, interrelated with perspective parameters of the world economy and energy sector. The conditions and parameters of relatively high and low world oil prices scenarios are described. |
| Shirov et al. (2016) | Russia and Europe: Energy union of energy conflict? (Eight years after) | The article discusses current issues of interaction between Russia and the EU in the energy sector at the present stage. It is stated that the formation of an energy union has more advantages for each of the parties in comparison with the conflict scenario. Alternatives to Russia's energy policy in case of deterioration of trade and economic relations with the EU are given. |
References
Ivanter V.V., Porfiryev B.N., Sorokin D.E., Eskindarov M.A., Maslennikov V.V., Shirov A. A., Abdikeev N.M., Abramova M. A., Bogachev Yu.S., Goncharenko L.I., Govtvan’ O. Dzh., Gusev M.S., Dubova S.E., Ershov M.V., Zubets A.N., Kolpakov А. Yu., Ksenofontov M.N., Kuvalin D. B., Mikheeva N.N., Moiseev A.K., Potapenko V.V., Solyannikova S.P., Stroev P.V., Tolkachev S. A., Uzyakov M.N., & Fedotova M. A. (2018). How to Boost the Development of the Russian Economy: Priority Actions (Suggestions for the Main Activities of the State until 2024). Finance: Theory and practice, 22 (1), pp. 4-15. (In Russian).
Semikashev V.V., Kolpakov. A.Yu. Merkulov S.K., & Terentiev N.E. (2016). Analysis and forecast of prospects for renewable energy development in the world until 2030. Alternative energy as a factor of modernization of the Russian economy: trends and prospects. Collection of scientific papers. Publisher: Scientific consultant limited liability company, Moscow. (In Russian).
Uzyakov M.N., Yantovskiy A.A., Ksenofontov M.Yu., Semikashev V.V., & Kolpakov A.Yu. (2016). Integrated approach to the construction of agreed scenarios of world oil production, consumption and price. Oil industry, 11, pp. 8-14. (In Russian).
Shirov A.A., Semikashev V.V., Yantovskii A.A., & Kolpakov A.Y. (2016). Russia and Europe: Energy union of energy conflict? (Eight years after). Studies on Russian Economic Development, 27 (2), pp. 127-137.
