The TIMES- Central Asian Caspian Model (TIMES-CAC)
Overview
As with MAPLE and NATEM, TIMES-CAC uses the TIMES modelling framework, as described in Section 3.6.1. The integrated bottom-up partial-equilibrium energy system model of the Central Asian Caspian (CAC) Area, titled TIMES-CAC, assembles the four separate but structurally-consistent single-region TIMES country models of Azerbaijan, Kazakhstan, Turkmenistan, and Uzbekistan by interconnecting them through the representation of energy flows and emission permits exchanges. The multiregional model is thought and designed as a comprehensive framework, able to explore national and/or supra-national forces, in a long-time horizon (until 2050), with the aim to test the effects of long-term energy export strategies on the energy system of the CAC countries and analyse trade-off curves between “risk” indicators and key KPIs, such as the system cost, the quantities exported and the corresponding revenues, as well as the emission reduction ambitions.
Key features of the TIMES-CAC model
Energy sectoral detail
The key components of the TIMES-CAC model are the technologies for the production of primary and secondary commodities (mining and extractions processes, power plants, refineries, etc.) together with the most representative appliances and devices of the demand sectors (boilers, light bulbs, road vehicles, etc.). The energy system development of each model region is driven by a set of demands for energy services in all sectors: agriculture, residential, commercial, industry, and transportation.
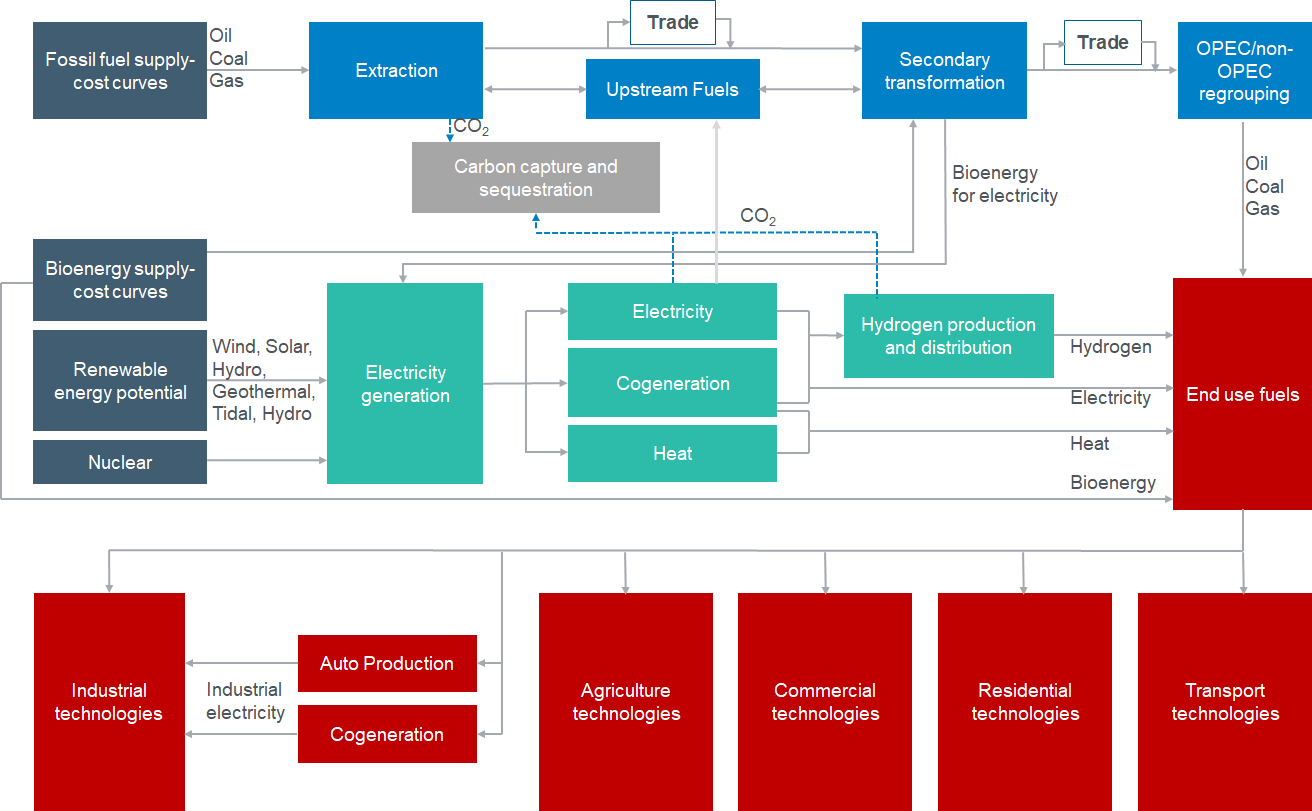
Representation of the TIMES-CAC energy system for each country
Source: Authors, based on the original design of Loulou and Labriet (2007)
Geographic coverage
In its default version, the TIMES-CAC model covers four explicit regions (countries). A number of export routes (towards three key areas of energy transit/consumption, namely Russia, Europe and China, which are all well-represented in the PARIS REINFORCE consortium) are also simulated, as shown in the following figures (structure and data as included in the current version of the model).
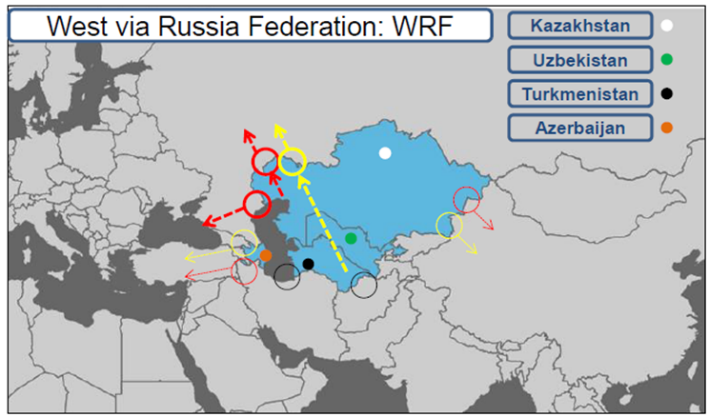
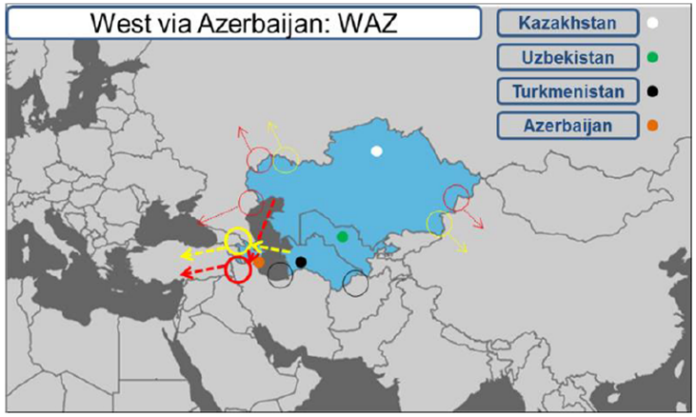
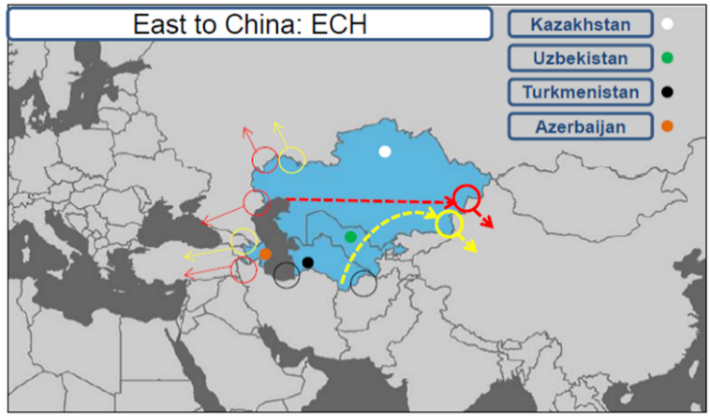
Regional representation in TIMES-CAC, connection with the rest of the world (RoW)
Source:Authors, elaborations for internal reports and conferences. Oil trade routes (red arrows) and gas trades routes (yellow arrows). A Southern route “to India” (through Afghanistan) can also be analysed.
Multi-year time periods
The time horizon over which TIMES-CAC simulates the evolution of the energy system is divided into a user-chosen number of time periods. In its default (current) version, the model runs from 2011 (base year) to the medium-to-long term through six periods (the representative years of which are: 2011, 2013, 2020, 2030, 2040, and 2050). All years in a given period are considered identical. For all quantities, such as installed technology levels, power plant capacities and energy and emissions flows, any annual input quantity (e.g. coal used in a power plant per year) or output quantity (e.g. electricity generated from the coal plant per year) related to a given time period applies identically to each of the years in that period.
In the framework of the project, the model can be further calibrated to different references years and run different horizons/organisation of periods, if necessary.
Intra-year time periods (time slices)
In addition to the multi-year time periods described above, in TIAM there are time divisions within a year, called “time slices”, which may be defined by the user, so as to capture different weather, consumer behaviours, and energy demand conditions at different times of the year (see Section 3.6.2.4 for the MAPLE model for further details on time-slices in the TIMES modelling framework). There are currently nine time-slices representing summer daytime, summer night time, and a peak moment in summer, winter daytime, winter night time, and a peak moment in winter, and an intermediate season day time and night time and peak moment in the intermediate season.
Climate module & emissions granularity
The model tracks the three main sources of GHGs: carbon dioxide (CO2), methane (CH4) and nitrous oxide (N20). A special module of the TIMES-CAC model can be enabled to let two more countries of the Central-Asian region (virtually modelled), to participate in the GHG emission reduction effort (through a virtual market trading scheme extended to four-plus-two regions of the area).
Drivers of energy and other GHG-emitting service demands
The TIMES-CAC model requires inputs concerning the degree to which energy service demands, as well as demand for other goods and services which result in GHG emissions (such as agricultural demand), will grow over the course of next decades in the different countries. It does this by using various socioeconomic inputs, as described in the following table (current default values) and sections. Data will be revised and updated before running the model under the PARIS REINFORCE project.
| Indicator | Values | In 2009 | Growth index (2009=100) | ||||
|---|---|---|---|---|---|---|---|
| 2020 | 2025 | 2030 | 2050 | ||||
| AZJ | Population | Million | 8.8 | 118 | 124 | 130 | *1.5 wrt the BY |
| GDP per capita (&) | S$’2000ppp | 8702 | 175 | 217 | 251 | Study-specific | |
| Aggregate demand for energy services | Index (+) | 100 | 199 | 265 | 328 | Study-specific | |
| KZK | Population | Million | 15.9 | 118 | 124 | 130 | *1.5 wrt the BY |
| GDP per capita (&) | US$’2000ppp | 8400 | 161 | 196 | 238 | Study-specific | |
| Aggregate demand for energy services | Index (+) | 100 | 167 | 209 | 264 | Study-specific | |
| TKM | Population | Million | 5.1 | 118 | 124 | 130 | *1.5 wrt the BY |
| GDP per capita (&) | US$’2000ppp | 9859 | 175 | 217 | 251 | Study-specific | |
| Aggregate demand for energy services | Index (+) | 100 | 179 | 226 | 269 | Study-specific | |
| UZB | Population | Million | 27.8 | 118 | 124 | 130 | *1.5 wrt the BY |
| GDP per capita (&) | US$’2000ppp | 2395 | 175 | 217 | 251 | Study-specific | |
| Aggregate demand for energy services | Index (+) | 100 | 185 | 238 | 283 | Study-specific | |
| Population | Million | 57.6 | 118 | 124 | 130 | *1.5 wrt the BY | |
| GDP per capita (&) | US$’2000ppp | 5678 | 170 | 208 | 246 | Study-specific | |
| Aggregate demand for energy services | Index (+) | 100 | 178 | 226 | 278 | Study-specific | |
Economic growth
As is the case for almost all the most important energy-producing countries, the CAC countries are also highly dependent on energy exports, and this dependence results in a very large share of the energy sector to the GDP and fundamental (critical) contributions to the State budgets. Economic growths are based on national specific projections for the medium-term, and on hypotheses (study- and scenario-specific) for the longer horizon. In general terms, the analysed storylines always assume a (quite fast) growth in domestic GDPs for all the cases and countries, that in a baseline case is equivalent to a an economic trend of around +4.5% (in terms of GDP, in average, to 2050).
But due to the abovementioned characteristics, economic growths in the CAC area (by country) should be always properly assessed and considered within a self-consistent (energy-related) storyline, in order to keep a certain degree of robustness of the scenario and of the projections.
Population growth
Population growths are also based on national (local) specific information in the medium term and on assumptions in the longer horizon (mainly inherited by a specific analysis for Kazakhstan), that result in a population growth rate of +1.2%, in average, in the long-term (2050), for the multiregional area. It is worth noting that, according to some local experts, the international analyses often “underestimate” the population growth rates of the area, due to the incorrect comparison with Russia (and the Former Soviet Union) and with the Russian ethnic groups (lower birth rates).
It should also be noted that the TIMES-CAC model can be adjusted to use other socioeconomic growth projections aside from the default.
Sectoral growth
The growth in the industrial, agricultural and retail business sectors in each region is partially derived from the national’s overall GDP growth, with each sector’s share of total GDP changing over time, and from the expected/planned production levels, constructions (e.g. square meters for services), and development of certain activities. Growth of residential households is derived from population growth and assumptions on average household size in each region.
Growth in each of these sectors drives energy demand as described in the next sub-section.
Energy demand drivers and demand elasticities
The economic, population and sectoral growths (e.g. physical production of industrial activities) are used as specific drivers for the growth in energy demands, in the same way as for the MAPLE and NATEM models, as detailed for the MAPLE model in Section 3.6.9.2.
Calibration of the model
The TIMES-CAC model is calibrated for the initial period (currently 2011) using a combination of IEA world energy statistics for the year 2011 and country-specific information, with the projections for the key energy-related investments and stocks (e.g. installed technology capacity) further calibrated until 2013-2015. The current intention is that the version of TIMES-CAC to be used in PARIS REINFORCE will have an updated energy statistics calibration (the most useful combination among the key international and local sources) to the most recent years. The main variables to be calibrated include: the capacities/stocks and operating levels of all technologies; the extracted, exported, imported, produced, and consumed quantities for all energy carriers; and the introduction/representation of recent (new) policy- and target-related elements (if any).
Mitigation/adaptation measures and technologies
TIMES-CAC is a technology-rich model that represents most major fossil fuel and low-carbon technologies that are envisaged to be available (for those systems) for at least the first half of the 21st century. By simulating the substitution of low-carbon for high-carbon technologies in response to their relative costs, as well as emissions constraints and/or carbon prices, the model simulates mitigation. The principal energy sector CO2 (and non- CO2) mitigation options are shown in the following table (the options that are not currently available but can be added in the model are marked with an asterisk*). Data will be revised and updated in the framework of the PARIS REINFORCE project, and in accordance with the international database and feedback of local experts.
| Upstream | |
| Synthetic fuel production | Hydrogen production |
|
|
| Electricity and heat | |
| Electricity generation | Heat generation |
|
|
| Transport | |
| Road | Rail |
|
|
| Air | Marine |
|
|
| Buildings | |
| Heating | Lighting |
|
Efficiency |
| Appliances | Cooling |
| Efficiency |
|
| Industry | |
| Process heat | Machine drives |
|
|
| Steam | CHP |
|
|
| CCS | Other |
|
|
| Agriculture | |
| Energy | Other |
|
|
| Non-CO2 | |
| Enteric fermentation + Digester + Cogeneration (Agriculture) | Flare gas recovery + on site use |
| Waste water processing with recovery + cogeneration (Industry) | Flare gas recovery + compression + distribution |
Economic rationale and model solution
The modelling framework and solution rationale is similar to the MAPLE and NATEM models, as detailed for MAPLE in Section 3.6.7.
The TIMES-CAC model computes a dynamic inter-temporal partial equilibrium for the (multi-) regional energy and emission markets, based on the maximisation of total surplus defined as the sum of surplus of the suppliers and consumers. In other words, it is assumed that the multi-regional system evolves, while maintaining intra-temporal and inter-temporal partial economic equilibrium, and always occupies the technical possibility frontier. The process of solving the model determines the optimal mix of technologies (capacity and activity) and fuels at each period, the associated emissions, the mining and “trading activities”, the quantity and prices of all commodities, all in time series from the base year to the time horizon of the model.
The model was mainly developed and used to assess the dynamics of the national energy system of the area in cooperative and non-cooperative manner, when energy export levels export levels are determined by the willingness-to-pay of the different “importers/customers”.
The model responds to economic incentives (such as revenues from the exports) by optimising the domestic energy system (supply and demand of each energy form), the energy exchanges within the multiregional system (CAC area), and with the external markets, in an “integrated” manner. A “discount” factor of 5% per year is usually used to value the costs of the energy system at different time points in the future. In other words, a cost of $100 one year in the future would be equated to a cost of $95 today. This discount factor can be changed. Implicit discount rates are also used at sectoral level.
Key parameters
The TIMES-CAC model is “by paradigm” a technology-rich tool, where techno-economic information is assigned to each process (existing and future) of the system, and therefore many datasets/parameters can be extracted and reported.
-
Based on the geopolitical and strategic role of the CAC area in the international
“energy” context, and on its specific technical and market characteristics that affect
the local energy and climate plans, the following key information is selected as the
“most important” parameters to monitor, discuss and evaluate in the framework of the
PARIS REINFORCE project for a successful integration of this model with the other
tools and analyses:
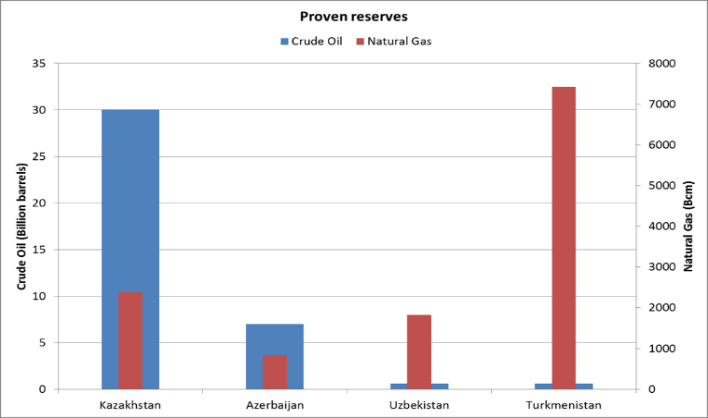
- Fossil fuel proven/possible reserves (mainly oil and gas) and expected production rates (P/R).
- Quantities and/or prices of trades (mainly for oil and gas), by area of import.
- Information about under construction/planned/possible energy projects/infrastructures.
- Burden/contribution of the countries/area to global climate targets (based on previous experiences, this is particularly relevant with respect to the gas allocation: domestic use vs. export), and national emission reduction goals.
- Energy efficiency improvements costs/limits (from the supply side to the demand side).
- Renewable energy and CCS costs/potentials.
- Local-specific priorities, targets, plans.
Parameters can be revised and updated in the framework of the PARIS REINFORCE project, following the feedback of national experts (stakeholder engagement), the comparative assessment with other modelling experiences, and the discussion with the partners (modellers).
Policy questions and SDGs
Key policies that can be addressed
-
As for all the TIMES-based models, TIMES-CAC predominantly works by specifying
either a carbon price (imposed as a tax) or a carbon emissions constraint in
each region that it represents, or alternatively all regions simultaneously.
For example the following further policies can be implemented:
- Minimum/maximum capacity factors on fossil fuel power generation plants (e.g. to simulate minimum or maximum desired levels of operation);
- Subsidies on particular technologies (through adjusting their costs or the explicit assignment of incentives);
- Constraints on the availability of particular technologies (e.g. “no nuclear”, variable renewables accounting for no more than 50% of electricity generation);
- Constraints on the growth rates of particular technologies (e.g. carbon capture and storage power generation capacity cannot grow at more than 20% per year)
- Inter-regional emissions trading (or no trading);
-
More in particular, TIMES-CAC is capable of exploring the direct economic advantage
of cooperation policies in the energy and climate change mitigation sectors for the
represented countries. The following cooperation policies in the area can be directly
modelled:
- exploitation of Caspian oil and natural gas resources;
- investment in the construction of cross-national new pipelines;
- maintenance of free exchange in the energy sector across the region; and
- creation of a joint CO2 emission permit system in the area.
Furthermore, the structure of the TIMES-CAC model allows to fully include the concept of “energy security” in the analysis (from the perspective of energy exporters), and to test the effects of long-term energy export strategies in the CAC region by exploring the trade-offs between a “risk” indicator and some key variables of the energy system such as the total cost, the quantities exported and the corresponding revenues, the climate targets of the region. Furthermore, (export) risk reduction goals can be combined with securing a minimum level of revenues from the hydrocarbon exports goals, with the aim to quantitatively evaluate the response of the energy sector and its sensitivity to different export strategies.
The following table provides additional information about the capability of the model to represent policies and measures per each key energy and climate dimension.
| Policies and Measures (by dimension) | Details |
|---|---|
| Decarbonisation | High capability (several mitigation options, regulatory and economic measures, etc.) |
| Energy Efficiency | High capability (several energy efficiency options, regulatory and economic measures, etc.) |
| Energy Security | High capability (key focus of the TIMES-CAC, risk and diversification targets) |
| Internal energy markets | Medium capability (gasification of the systems, electrifications, partial/complete phase-out of fuel subsidies, etc.) |
| Research, Innovation and competitiveness | Low-Medium capability (implicit and/or ex-post) |
Implications for other SDGs
Apart from the abovementioned dimensions, a number of SDGs other than climate action can be taken into consideration and investigated making use of the TIMES-CAC model, as shown in the following table.
| SDG | Details |
|---|---|
| §1. No Poverty (e.g., intra-country distributional impact by income level) | Trade-offs between energy poverty reduction (residential) measures vs. energy consumption can be partially explored. |
| §3. Health (e.g., air-pollution related mortality) | Measures to tackle the use of solid fuels in buildings (not negligible fractions in the CAC area, and direct cause of pollution-related mortality) can be included. |
| §7. Affordable and clean energy (e.g., traditional biomass use, %renewable energy) | Cost-effectiveness of RES within a specific storyline. |
| §8. Decent work & economic growth (e.g., impact on GDP per capita, jobs) | Energy export revenues can be tracked and analysed to evaluate the corresponding relevance/impact on the State budget (e.g. capability to fund RES, etc.) and on the domestic macroeconomic indicators. | §15: Life on land (e.g., land use for forests, rate of land use change) | Afforestation measures can be taken into account; RES potential/exploitation and investment decisions (e.g. energy infrastructures) can be subject to land-specific constraints (natural and regulatory). |
Recent publications using the TIMES-CAC model*
| Study | Focus | Key findings |
|---|---|---|
| Kerimray et al. (2018) | Long-Term Climate Change Mitigation in Kazakhstan in a Post Paris Agreement Context | Under the Paris Agreement, Kazakhstan’s nationally determined contribution (NDC) target is to reduce its greenhouse gas emissions (GHG) by between 15 and 25% by 2030 compared with 1990 levels. Kazakhstan’s energy system is highly carbon intensive and GHG emissions continue to steadily grow, indicating insufficient progress towards achieving the NDC emissions reductions announced under the Paris Agreement. This chapter presents modelling analysis that assesses a least-cost long term (2050) pathway towards achieving these NDC targets. The results demonstrate how ambitious a 25% GHG emissions reduction pathway is compared with the current energy policies and mitigation actions. Such a reduction requires an almost full phase-out of coal consumption in power generation by 2050. |
| Bakdolotov et al. (2017) | Techno-economic modelling to strategize energy exports in the Central Asian Caspian region | This paper studies the concept of energy security from export-oriented countries’ point of view. It aims to test the effects of long-term energy export strategies in the Central Asian Caspian (CAC) region, by exploring the trade-offs between a “risk” indicator and some key variables of the energy system such as the total cost, the quantities exported, and the corresponding revenues. Risk reduction goals are combined with securing a minimum level of revenues from the hydrocarbon exports goals. It is also attempted to provide a definition and a quantification of a risk indicator on the basis of four components. |
| Kerimray et al. (2015) | Improving Efficiency in Kazakhstan’s Energy System | There are various reasons for inefficiencies in Kazakhstan’s energy system: administrative and economic (statistical double counting of energy flows, above normative losses and low profitability), geographic (the extremely continental climate and low population density) and technical considerations (high share of coal in generation mix, high wear on main and auxiliary equipment in energy intensive sectors, high wear on electric lines, dilapidation of housing stock, and an absence of control systems for energy savings) all contribute to the high energy intensity. This study explores energy efficiency potential by analysing the evolution of the Kazakh energy system. All the technical inefficiencies have been taken into consideration through the explicit representation of existing inefficient technologies/chains in a TIMES-based model. Under the assumptions of a market-oriented development of the economic system, even without specific policies (Business as Usual), the model suggests significant energy efficiency improvement: 22 Mtoe (million tons of oil equivalent) by 2030 and a 40 % reduction in energy intensity of GDP by 2030. |
| De Miglio et al. (2014) | Cooperation benefits of Caspian countries in their energy sector development. | This paper studies the development possibilities of the energy systems of four Central Asia and Caspian countries. It explores options that improve their domestic energy efficiencies and increase their export of fossil energy commodities. With the help of scenario analyses, it evaluates the direct economic advantage of improving the domestic energy efficiencies. Furthermore it calculates the direct economic advantage of cooperation. It finds out that a new/different geo-economic attitude brings USD billions of annual economic benefits, particularly if the countries aim to differentiate their export routes, increase the amount of export and contribute to climate change mitigation. |
*or using national-specific analysis based on the utilisation of single-region tools inherited by the TIMES-CAC model
References
Bakdolotov, A., Miglio, R. D., Akhmetbekov, Y., & Baigarin, K. (2017). Techno-economic modelling to strategize energy exports in the Central Asian Caspian region. Heliyon, 3(4), e00283.
De Miglio, R., Akhmetbekov, Y., Baigarin, K., Bakdolotov, A., & Tosato, G. (2014). Cooperation benefits of Caspian countries in their energy sector development. Energy Strategy Reviews, 4, 52–60.
Energy Charter (2015) International Energy Security: Common Concept for Energy Producing, Consuming and Transit Countries.
Energy Information Administration (2013) Overview of oil and natural gas in the Caspian Sea region, 1–25. http://www.eia.gov/countries/analysisbriefs/Caspian_Sea/caspian_sea.pdf.
International Energy Agency (2012) Beyond 2020, Extended and Summary Energy Balances of Non OECD countries, http://www.iea.org/statistics/.
Kerimray, A., Suleimenov, B., De Miglio, R., Rojas-Solórzano, L., & Ó Gallachóir, B. (2018). Long-Term Climate Change Mitigation in Kazakhstan in a Post Paris Agreement Context. In G. Giannakidis, K. Karlsson, M. Labriet, & B. Ó. Gallachóir (Eds.), Limiting Global Warming to Well Below 2 °C: Energy System Modelling and Policy Development (pp. 297–314)
Kerimray, A., Baigarin, K., Bakdolotov, A., De Miglio, R., & Tosato, G. (2015). Improving Efficiency in Kazakhstan’s Energy System. In G. Giannakidis, M. Labriet, B. Ó Gallachóir, & G. Tosato (Eds.), Informing Energy and Climate Policies Using Energy Systems Models: Insights from Scenario Analysis Increasing the Evidence Base (pp. 141–150)
Loulou R. & Labriet M. (2007). ETSAP-TIAM: the TIMES integrated assessment model Part I: Model structure. Computational Management Science, 5(102), 7–40.
