NEMESIS - New Econometric Model of Evaluation by Sectoral Interdependency and Supply
Short overview
The NEMESIS model (New Econometric Model of Evaluation by Sectoral Interdependency and Supply) is a sectoral detailed macroeconomic model for the European Union (Boitier et al. 2018). It is a system of economic models for every European country (including the United Kingdom), devoted to study issues that link economic development, competitiveness, employment and public accounts to economic policies, and notably all structural policies involving long term effects. The essential purpose of the model is to provide a consolidated framework to realise “Business As Usual" (BAU) scenarios (or other alternative scenarios), up to 30 to 40 years, and to assess the socioeconomic impact of the implementation of all additional policies not already implemented in the BAU. The main mechanisms of the model are based on the behaviour of representative agents: firms, households, government and rest of the world. From the supply side, the model distinguishes 30 different economic activities that produce goods and services through production functions and, to do so, use production factors: capital, energy, low and high-qualified labour and other intermediate consumption. All these economic activities are interrelated by inter-sectoral exchanges (conversion matrices) and external trades with other EU countries and the rest of the world. NEMESIS includes a detailed energy-environment module that allows the model to deal with climate mitigation policies, at EU and EU-national level. This module enhances the representation of the energy-system of each Member State by detailing the energy used (ten different products) by each economic activity but also by households. It also details the power generation sector by allocating electricity production between different technologies through diffusion curves. CO2 emissions from fossil fuel combustion (FFC) are then calculated from fossil fuel consumption whereas other GHGs (CO2 from others sources, CH4, N2O, HFCs, PFCs and SF6) are either calculated by the model (however more roughly than CO2 from fossil fuel combustion) or calibrated on external studies. Furthermore, the model can be relatively easily linked to other tools. In case of a linkage with more detailed energy-system models, NEMESIS is then used to assess the socioeconomic impacts at EU and EU-national level, with detailed characterisation of the energy-system being delegate to the detailed energy models.
Key features of the NEMESIS model
Geographical coverage
NEMESIS models each Member State of the European Union (including the United-Kingdom) . The rest of the world is defined through a set of assumptions according to economic development, good and services prices, exchange rates, etc.
Economic activities coverage
As NEMESIS is a macroeconomic model, it covers all the economic activities in each EU Member State, but in each country the economy is divided in 30 different economic activities of which: one for agriculture, fisheries and forestry, six for utilities, thirteen for manufacturing activities, one for construction, three for transport activities and six for services (see the table below).
| No | Economic activity | No | Economic activity |
|---|---|---|---|
| 01 | Agriculture | 16 | Manufacture of food products; beverages and tobacco products |
| 02 | Mining and quarrying expect oil and gas | 17 | Manufacture of textiles, wearing apparel, leather and related products |
| 03 | Oil and gas extraction | 18 | Manufacture of paper and paper products; Printing and reproduction of recorded media |
| 04 | Manufacture of paper and paper products; Printing and reproduction of recorded media | 19 | Manufacture of rubber and plastic products |
| 05 | Manufacture of coke and refined petroleum products | 20 | Other manufactures |
| 06 | Electricity | 21 | Construction |
| 07 | Water collection, treatment and supply | 22 | Wholesale and retail trade |
| 08 | Manufacture of basic metals | 23 | Accommodation and food service activities |
| 09 | Manufacture of other non-metallic mineral products | 24 | Land transport and transport via pipelines |
| 10 | Manufactures of chemicals & pharmaceutical products | 25 | Air and water transport |
| 11 | Manufacture of fabricated metal products, except machinery and equipment | 26 | Other transport activities |
| 12 | Manufacture of machinery and equipment n.e.c. | 27 | Information and communication |
| 13 | Manufacture of computer, electronic and optical products | 28 | Bank, finance, insurance & real estate |
| 14 | Manufacture of electrical equipment | 29 | Other market services |
| 15 | Manufacture of transport equipment | 30 | Non-market services |
In green: agriculture, fisheries and forestry; in red: utilities, in blue: manufacturing industries; in brown: construction; in purple: transport and in orange: services
Databases
The NEMESIS model is designed to deliver outputs in annual step. NEMESIS with its level of detail requires a big consolidated database for its functioning. Data are compiled from numerous sources (Eurostat, 2018; WIOD - Timmer et al., 2015; EEA, 2019; etc.) and are post-processed for ensuring their whole accounting coherency. Thus, the dataset used by the model are frequently updated. Currently the model is calibrated for the year 2014, but for some data, historical value goes up 2017, such as for energy consumption and GHG emissions and the model can deliver output up to 2050.
The economic core
On the supply side, each sector is modelled as a representative firm determining its production level and the use of production factors (Capital, low- and high-qualified labour, energy and other intermediate consumptions) given its expectations on demands and prices. Nested CES production functions are used to characterise the production technology with substitution elasticity coming from econometric works or from literature (see the figure below). Price setting is defined under monopolistic competition, with constant margin rates, different among sectors and inter-sectoral exchanges are captured by conversion matrices that allocate the intermediate consumption (input-output matrices) and investment demands to economic activities producing the required goods and services.
Regarding households, final consumption is calculated as follows: (i) firstly, the aggregate consumption is computed based on the real disposable income; (ii) then, the aggregate consumption is allocated among 27 consumption purposes of durable and non-durable goods. The income that is not consumed results in savings, which are split between investment in real estate and financial or monetary assets.
The labour market is modelled on the basis of the demand for labour, depending on the optimisation of production levels done by firms, and its supply, which is based on population’s age and qualification levels (approximated using education levels). Wages are determined by augmented Philipps curves, and they are calculated separately for high- and low-qualified workers.
As for international trade, each EU country exports to (and imports from) two groups of trade partners: intra-EU and extra-EU countries. The determinants of trade are the relative prices of domestic and foreign goods and services, capturing the competitiveness effect, and the volume of exchanges, which is approximated by sectoral demand for goods and services. Different prices are set for intra-EU and extra-EU exports (and imports), to account for the differences in trade costs.
Regarding public finances, the model incorporates both subsidies and the main forms of taxation, such as taxes on production and imports, including most notably VAT, taxes on incomes and wealth, social contributions, and taxes on capital. VAT rates are modelled on the basis of the actual VAT rates (as published by European Union, DG TAXUD, 2019). Carbon price can also be introduced in the model and different recycling options can be assessed. Finally, public finance is relatively detailed allowing the model to provide indicators on government’ expenditures, incomes and balances.

General scheme of the NEMESIS model' economic core
Energy module & emissions granularity
Besides economic core, the model includes a detailed energy-environment module. For each economic activity, the energy demand (E in the figure below) is split, thanks to a nested CES function, in ten different energy sources (electricity, oil, gas, solid fuel, biomass including wood, biogas, biofuel and other biomass, geothermal and industrial and urban wastes). Furthermore, the “electricity” sector is not modelled as other sectors, there exists a specific modelling for power generation in order to properly represent energy mix capability in power generation. For this purpose, fourteen different power generation technologies are distinguished, namely: nuclear, hydro, gas, oil, solid fuel, wind (onshore and offshore), geothermal, solar (large scale PV), industrial waste and biomass and waste. Nuclear and hydroelectric power generation technologies are set exogenous because, this setting is assumed to reflect more energy policy choices of each EU member state than only pure economic choices. Other production sources are endogenous and are modelled through diffusion curves (logistic function).
| Energy products | |
|---|---|
| Fossil fuels | |
| (of which) | Oil |
| Gas | |
| Coal | |
| Electricity | |
| Biomass | |
| (of which) | Wood |
| Biomass | |
| Biofuels | |
| Others | |
| Solar | |
| Industrial and urban wastes | |
| Power generation technology | |
|---|---|
| Fossil fuels | |
| (of which) | Coal |
| Oil | |
| Gas | |
| Nuclear* | |
| Geothermal* | |
| Hydro* | |
| Wind | |
| (of which) | Onshore |
| Offshore | |
| Solar | |
| (of which) | PV |
| CSP | |
| Biomass & wastes | |
| (of which) | Wood |
| Biogas | |
| Others | |
| Tidal | |
| Industrial wastes | |
In brown: CO2 emitting technologies, in green: renewable technologies (only 50% for urban wastes) and in blue other technologies. *: production from these technologies is exogenous.
From the energy consumption calculated, the CO2 emissions from fossil fuel combustion can be quantified. For other emissions, except for land use emissions, either exogenous values coming from external studies are assumed or a basic modelling with emissions coefficient indexed on emitting economic activity is used (as detailed as the model allows).
As the geographical coverage of the model is limited to the EU, the model does not include emissions impacts on climate such as radiative forcing. The model can only implement climate change mitigation policies on the basis of GHG emissions targets. Finally, the model does not currently include neither impact of climate change on the economic activity (damage function) nor climate change adaptation options.
Socioeconomic dimensions
The socioeconomic dimension is essential in the NEMESIS, as on the one hand, it serves as drivers (exogenous variables) of the modelling simulations and on the other hand large a part of the model outputs concern socioeconomic variables. European demographics, particularly working age population, the economic context outside the EU (including GDP growth), exogenous financial variables and labour hypotheses are the main drivers of the model whereas EU GDP growth is an output of the model. Nevertheless, in several multi-model analyses of climate change mitigation options, the socioeconomic characterisation of scenarios already includes GDP projections as in the case for the Shared Socioeconomic Pathways or SSP, (Riahi et al., 2017) including three sets of GDP projections (Cuaresma, 2017; Dellink et al., 2017 and Leimbach et al., 2017). Thus, when such socioeconomic characterisation exists the model can be constrained in order to replicate, as close as possible, the EU GDP projections.
EU demography
The first set of inputs required by NEMESIS is related to European demographics. This is essential to define the labour force and then the state of the labour market, and, to a lesser extent, its influence on the households’ final consumption. For NEMESIS, the demographic data include population by age groups and by qualification for each EU country. The age groups that are distinguished are: [0-14], [15-24], [25-54], [55-64], [65-74] and [75-max]. Furthermore, demographic data for NEMESIS required the level of qualification, it is measured from two different levels of educational attainment:
- low-qualified including ISCED from 0 to 4; and
- highly-qualified including ISCED from 5 to 8.
Historical data come from Eurostat (2017) while, usually, population projections by age group come from Eurostat (2018b); however alternative population projections (with short-term adjustments to ensure consistency between historical data and projections) can be used, including the SSPs (KC and Lutz, 2017) that feature projections by qualification levels (educational level attainment).
Financial exogenous variables
In NEMESIS, the capital market is not modelled and the interest and exchange rates are both exogenous. It is therefore necessary to describe the financial context in which the EU economies are expected to operate in future years. These assumptions can be modified for scenarios including specific evolutions on interest or exchange rates. In the model, while all variables are defined in euros, the exchange rates are defined (i) between the euro and the Rest of the World currencies and (ii) between the euro and the currencies of the EU countries that do not belong to the Eurozone. These assumptions are based on external studies, mainly focusing on the €/$ exchange rate. For interest rates, that are relevant mainly for the user cost of capital and agents' accounts, projections are also based on external studies or on specific assumptions related to the scenario definition.
World demand indicators and price
The Rest of the World (non-EU countries) regions are not directly modelled in NEMESIS and it is necessary to make assumptions on the evolution of global demand for the different products and on global prices of the different commodities that are traded by EU countries. Generally, the exogenous variables representing the demands for the EU coming from the rest of the World are calculated from the WIOD2016 dataset (Timmer et al., 2015). The methodology uses the World Input-Output Table (WIOT), which retraces the inter-industrial exchanges between sectors, with also the geographical origin of the products used. The combination of these matrices with assumptions on the growth of GDP in the different countries outside EU allows to calculate vectors of addressed demands per country and per sector. The expected growth of GDP for non-EU countries are exogenously defined and based on external studies, SSP scenario could be used here or alternatively, GDP for non-EU countries and even sectoral value added if available could come from other models, as a part of an operational linkage between a global macroeconomic model and NEMESIS.
The second set of exogenous variables correspond to the price of the imported goods and services from the rest of the World defined for each country and sector. These are defined exogenously on the basis of past trends or on external studies when available.
The last set of exogenous variables defining the general context of the World economy is related to the prices of raw materials and notably of fossil fuels (oil, gas and coal). Here again, fossil fuel prices could be an element of linkage between a global IAM, in which fossil fuels market are modelled, and the NEMESIS model.
Socioeconomic indicators
NEMESIS can deliver numerous economic indicators at EU and country level. There are three main layers of economic indicators:
- macro-economic, such as GDP (European and EU-national) and its counterparts (final consumption, investment, exports, imports, etc.), unemployment rates, etc.;
- sectoral, such as production, value added and employment per sector; and
- agent accounts for: government, non-financial corporations, financial corporations, households including non-profit institutes serving households (NPISH), and the rest of the world.
Some key parameters for climate change mitigation assessment
The parameters of behavioural equations are either estimated by econometrics works or calibrated. It is the case for the production factors (capital, labour, energy and intermediate consumption), for households’ consumption purposes or the wage equation that describes, roughly, the labour market functioning. Even if a large set of parameters are important when assessing EU climate change mitigation policies, we provide below some values or ranges for a restricted list of them that we assume the most important for the assessment of climate mitigation policy with the model.
Substitution elasticity between production factors
The elasticities of substitution between production factors in the nested constant elasticity of substitution (CES) production function are differentiated for each production factor and for each economic activity. The figure below presents the general structure of the nested CES production function including the range of the elasticity of substitution at each level of the nesting (within brackets).

Structure of the nested CES production functions in NEMESIS
NB: Y is the production, A: the innovation services, X, KLE, KLHSE, and KE are compounds inputs, M: intermediate consumptions except energy, LLS: low-qualified labour, LHS: high-qualified labour, K: the capital stock and E: the energy consumption.
Mitigation/adaptation measures and technologies
Substitution elasticity between energy sources
Similarly, the following figure presents the general structure of the nested CES function allowing the calculation of the energy demand by source, with the value of the substitution elasticity that is calibrated for each economic activity.
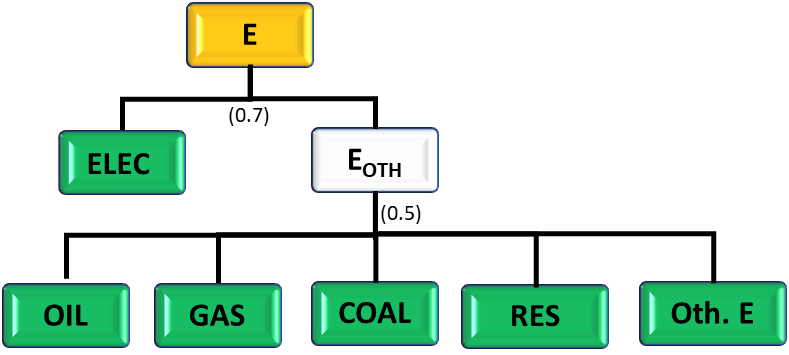
Energy product nested CES function
NB: E: the energy consumption, ELEC: the electricity consumption, EOTH: a compound of other energy products than electricity, OIL: petroleum products consumption, GAS: natural gas consumption, COAL: solid fossil fuels consumption and Oth. E: the consumption other energy products (individualised by product).
Mitigation/adaptation measures
Alone or linked
Usually, there exists two different possibilities for the NEMESIS model to deal with climate change mitigation actions either using the model including the energy and environment module or using NEMESIS linked with other modelling tools, typically more detailed and accurate to assess these actions, especially energy-system models. In the first case, climate change mitigation essentially corresponds to complying with a pre-defined annual GHG emissions binding target through the implementation of economic instruments in the model, such as carbon prices. In the second case, climate change mitigation policies are implemented (at least partially, when the linkage concerns only specific sectoral tools) in the soft-linked tool(s). This inter-linkage aims at expressing climate change mitigation costs as calculated by the coupled tool(s) in the NEMESIS model and it requires significant work to ensure consistency between variables exchanged among all tools, including in particular a proper interpretation of the meaning of these variables. Some of past studies of both settings are included in the following table.
Climate change mitigation policies: a set of assumptions to define
Finally, and more particularly when NEMESIS is used as a standalone model, i.e. without linking it with other modelling tools, the implementation of climate change mitigation options requires the definition of assumptions on the policy design, on the economic instruments implemented and on what is happening in the rest of the world.
The model can deal with different economic instruments for the implementation of climate change mitigation in the EU: “universal” carbon prices, sectoral and/or nationally differentiated carbon prices, support to “green” technologies, permit allocation with different allocation rules, etc. According to the economic instruments implemented, it is also necessary to define the recycling scheme of the potential revenues produced by a new taxation (or the origin of the resources in the case of public financial supports), such as reduction of other taxes or financial compensation to economic agents, etc. All these aspects must be defined in the design of the scenario, because they will impact the outputs of the model.
Beside internal EU policy, it is also important to define what is happening in the rest of the world. Indeed, the characterisation of the socioeconomic impacts of mitigation options implemented in the rest of the world is required either on the basis of exogenous assumptions or drawing from results of interlinked global modelling tools, as it affects the output of the NEMESIS model, as presented in Section 3.5.4.3. For instance, a unilateral implementation of a stringent climate change mitigation policy in EU can have negative impacts on the competitiveness of EU firms and can even lead to new design of policy options in the EU, such as carbon border tax or free permit allowance in the EU emissions trading system (ETS).
Recent publications using the NEMESIS model
| Paper | Topic | Key findings | Linkage with other modelling tools |
|---|---|---|---|
| France Stratégie, (2019) | Assessing the French social value of carbon – A multi-model analysis | The report provides a comprehensive overview of analyses enabling definition of a trajectory of values to be taken into account if we are to achieve the goal of net zero GHG emissions by 2050 in France. Among other analyses, a multi-model analysis has been achieved using two different kind of models: macroeconomic models and energy-system models. Finally, the report recommends, for 2030, to put forward a shadow price of €250 per ton of CO2e. By 2050 it is expected to align with the estimated costs of the enabling technologies required for decarbonisation —therefore a cautious range of €600 to €900/ton of CO2e. | No |
| Muller, et al., (Forthcoming) | Carbon footprint of the French economy and scenarios of carbon border adjustment in EU | Based on the calculation of the carbon footprint embodied in the EU imports (done in the first parts of the report), the last part of the report presents the macroeconomic effects (on GDP and employment) in the European Union and in France of adopting carbon border adjustment mechanisms. The results show that the implementation of a tax on the carbon content of EU importations can reduce the negative impacts of stringent GHG mitigation policies, within the EU, on competitiveness and furthermore with more positive effects when incomes from this tax are redistributed to European economic agents. | No |
| Duscha, et al., (2016) | Impact of RES deployment on employment in EU | The paper assesses whether renewable energy deployment in Europe can provide a “triple dividend”, at which ambition levels of 2030 RES targets, and what the role of the support policy scheme for electricity is. It applies two types of models: a detailed techno-economic sectoral model of the deployment of RES and two macroeconomic models. Our findings suggest that up to 2030 our triple-dividend hypothesis holds even under a declining role of Europe as a technology provider for the rest of the world. More ambiguous is the order of magnitude of the effects on GDP and employment, which differs noticeably depending on the economic theory applied in the different models. Nevertheless, both models predict slightly higher GDP and employment in 2030 when implementing ambitious RES targets. | Yes (with GREEN-X a detailed modelling tool for renewables) |
| Enerdata, et al., (2015) | “Energy-Air-Climate" scenarios for France up to 2035 (Multi-model analysis) | The report provides a quantified scenario of Energy-Air-Climate for France up to 2035. The quantification has been done with the support of different modelling tools (sectoral energy system, global energy-system, macroeconomic model). Three scenarios have been quantified: a reference scenario including existing policy instruments; a more ambitious scenario, as regards of GHG emissions mitigation including additional policy measures; and a very ambitious scenario with reinforced GHG mitigation policies. These are used as benchmark scenarios for the French climate policies. Here, the NEMESIS model has assessed the socioeconomic impact of the two ambitious scenarios in terms of GDP, employment and detailed economic activity. | Yes (with POLES, an energy-system model and micro-analyses) |
| Capros, et al., (2014) | European decarbonisation pathways under alternative technological and policy choices: A multi-model analysis | This paper explores in a systematic manner the required energy system transformation and the associated costs incurred for the EU in order to meet the decarbonisation targets as specified in the EU Roadmap 2050, i.e. the 80% GHG emissions reduction target and the equivalent carbon budget by 2050. Seven large-scale energy-economy models, are employed for the simulation and quantification of alternative EU decarbonisation pathways under technological limitations and climate policy delays. The models’ results show that the EU emissions reduction target is feasible with currently known technological options at low costs (lower than 1% of GDP in the period 2015–2050). | No |
References
Boitier, B., Fougeyrollas, A., Le Mouël, P., & Zagamé, P. (2018). NEMESIS Model: Full description. Tech. rep., SEURECO.
Timmer, M. P., Dietzenbacher, E., Los, B., Stehrer, R., & Vries, G. J. (2015). An Illustrated User Guide to the World Input-Output Database: the Case of Global Automotive Production. Review of International Economics, 23, 575-605. doi:10.1111/roie.12178
Dellink, R., Chateau, J., Lanzi, E., & Magné, B. (2017). Long-term economic growth projections in the Shared Socioeconomic Pathways. Global Environmental Change, 42, 200-214. doi:10.1016/j.gloenvcha.2015.06.004
Leimbach, M., Kriegler, E., Roming, N., & Schwanitz, J. (2017). Future growth patterns of world regions – A GDP scenario approach. Global Environmental Change, 42, 215-225. doi:10.1016/j.gloenvcha.2015.02.005
Riahi, K., Vuuren, D. P., Kriegler, E., Edmonds, J., O'Neill, B. C., Fujimori, S., N. Bauer, K. Calvin, R. Dellink, O. Fricko, W. Lutz, A. Popp, J. Crespo Cuaresma, S. KC, M. Leimbach, L. Jiang, T. Kram, S. Rao, J. Emmerling, K. Ebi, T. Hasegawa, P. Havlik, F. Humpenöder, .L. Aleluia Da Silva, S. Smith, E. Stehfest, V. Bosetti, J. Eom, D. Gernaat, T. Masui, J. Rogelj, J. Strefler, L. Drouet, V. Krey, G. Luderer, M. Harmsen, K. Takahashi, L. Baumstark, J. C. Doelman, M. Kainuma, Z. Klimont, G. Marangoni, H. Lotze-Campen, M. Obersteiner, A. Tabeau and Tavoni, M. (2017). The Shared Socioeconomic Pathways and their energy, land use, and greenhouse gas emissions implications: An overview. Global Environmental Change, 42, 153-168. doi:10.1016/j.gloenvcha.2016.05.009
Muller, S., Boitier, B., Fougeyrollas, A., Lai, F., Beylot, A., & Villeneuve, J. (Forthcoming). L'empreinte carbone de la demande finale intérieure et des importations de la France - Comparaison des bases de données, focus sur la filière des métaux et analyse des vulnérabilités. IODA research project Final Report, ADEME.
Duscha, V., Fougeyrollas, A., Nathani, C., Pfaff, M., Ragwitz, M., Resch, G., Schade, W., Breitschopf, B. and Walz, R. (2016, 8). Renewable energy deployment in Europe up to 2030 and the aim of a triple dividend. Energy Policy, 95, 314-323. doi:10.1016/j.enpol.2016.05.011
Enerdata, Energies Demain, Seureco, Citepa, Mines ParisTech, & Armines. (2015). Scénarios prospectifs Energie - Climat - Air pour la France à l’horizon 2035. Rapport Final - Synthèse des résultats.
Capros, P., Paroussos, L., Fragkos, P., Tsani, S., Boitier, B., Wagner, F., Busch, S., Resch, G., Blesl, M., and Bollen, J. (2014). European decarbonisation pathways under alternative technological and policy choices: A multi-model analysis. Energy Strategy Reviews, 2, 231-245. doi:10.1016/j.esr.2013.12.007
