ALADIN - ALternative Automobiles Diffusion and INfrastructure
Short overview
ALADIN is an agent-based simulation model for assessing the market diffusion of alternative fuel vehicles (AFV). The acronym ALADIN stands for ALternative Automobiles Diffusion and INfrastructure. To date, the simulation comprises the market diffusion of passenger cars and heavy-duty vehicles in Germany and Europe until 2050. The simulation is based on driving data of several thousand individual vehicles that are treated as agents purchasing new vehicles. Changes in prices, user preferences, and model availability lead to market evolution for fuels and vehicles in road transport.
Methodology
Model core for Germany
The simulation model ALADIN calculates the market diffusion of AFVs based on a comparison of the economic efficiency of different drive systems and considering obstructive and supportive factors for approximately 6,500 driving profiles. The successive approach allows the effects of individual influencing factors on market evolution to be analysed separately and thus makes it more transparent.
The costs of buying and using a vehicle of course play an important role for potential buyers when making a purchasing decision. In commercial fleets, the economic aspects are even more important. Compared to conventional cars, AFV are generally more expensive to purchase, but they are often cheaper to run because of lower fuel and maintenance costs, among other things. It is therefore essential to look at costs in terms of the total use, in order to determine for which utilisation or driving profiles electric cars are more economical than conventional ones. Total cost calculations for vehicles are correspondingly a common component of models of market penetration of electric vehicles.
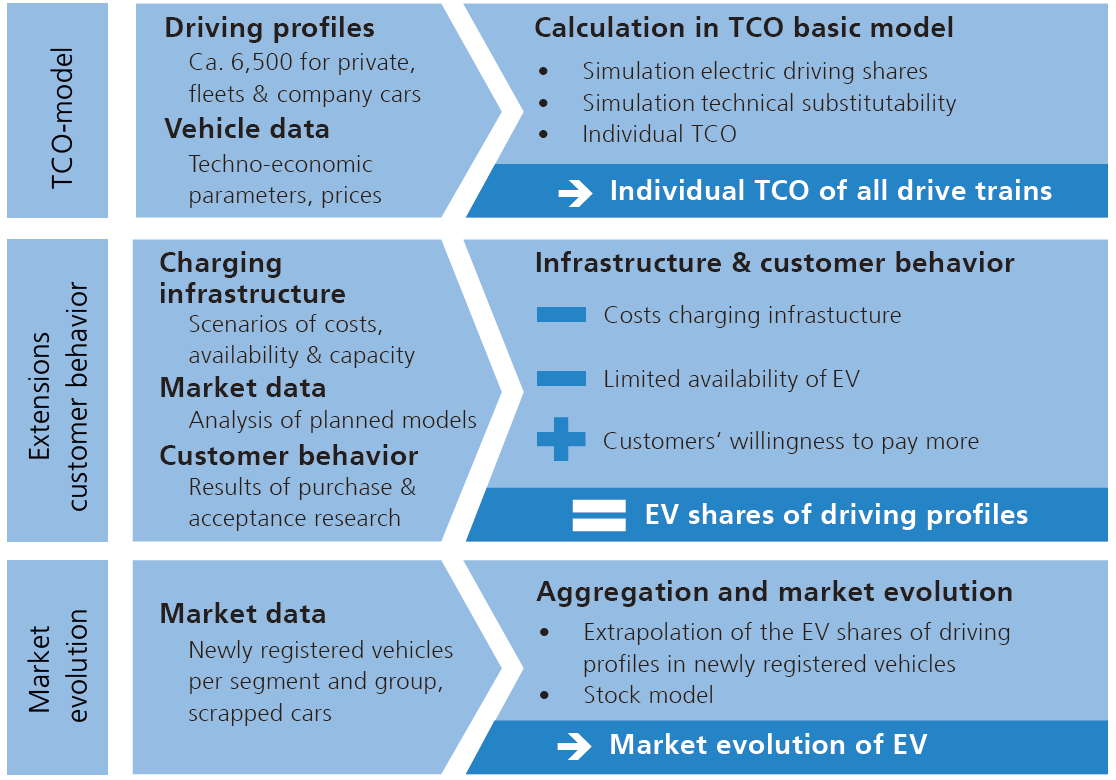
The model consists of three basic steps (see the figure below). In a first step, the costs of total use, referred to as TCO (Total Cost of Ownership), are ascertained for alternative and conventional vehicles. The TCO comprise the purchase and operating costs for the respective vehicle and are calculated from a user’s perspective. Three user groups are distinguished—private, commercial (only fleet vehicles) and company cars—because of their different rates of taxation and depreciation options as well as their deviating patterns of utilisation. Because the TCO are also strongly influenced by the size of the vehicle, different car segments are also distinguished.
The drive technologies analysed included battery electric vehicles (BEV), plug-in electric vehicles (PEV), range-extended vehicles (REEV), plug-in hybrids (PHEV), CNG vehicles and fuel-cell electric vehicles (FCEV) as well as conventional gasoline and diesel vehicles. For the TCO calculations, the cheapest respective drive technology is selected.
General structure of the ALADIN model.
One of the key innovations of ALADIN compared to previous TCO analyses is that the calculations are not made based on average annual mileages but are instead based on real-life driving profiles. A driving profile covers all the trips including the purpose, length of route, departure and arrival time, duration as well as information about the vehicle over an observation period of at least one week. Profiles vary widely by user even within the different groups and have a very strong influence on the economic efficiency of electric vehicles. The barrier presented by BEV’s limited range is explicitly considered in the analyses; each individual driving profile is analysed according to whether the driver is able to make all the trips with a BEV. In addition, the electric driving share of PHEV or REEV is simulated individually for each driving profile. This is important to obtain realistic results on economic efficiency, which depends on the share of electric driving and is especially relevant for PHEV and REEV. The first step, therefore, is to make TCO calculations on this basis.
In the second step, the TCO calculations are extended by including the costs of the main charging infrastructure. This is done in order to put the assessment of the economic efficiency in the TCO calculations on a broader basis. Charging infrastructure costs vary widely depending on the charging type and location. For instance, using private charging infrastructure is generally cheaper for drivers with a garage than for drivers using public charging infrastructure, on which on-street parkers have to rely. Because the methodology is a simulation which does not represent spatial modelling but only trip purposes (such as for example “going home”, “going to work”, “going shopping”), statements about the infrastructure are only possible to a limited extent. The infrastructure assumption made is the same for all users in the respective user group. Depending on the scenario, car users are provided with a different amount of charging infrastructure (for example, only charging at home for private users and only charging at work for commercial users). In terms of costs, however, only the primary charging point (e.g. the private wall box of garage owners) is classified.
The brand and size of a vehicle are also important factors influencing the decision to buy. For instance, many buyers are extremely loyal to a particular brand. There will continue to be a restricted range of models and brands of electric vehicles available in the near future, which represents a limiting factor for the market evolution of electric vehicles. The restricted choice and availability of brands are therefore taken into account in the model. This is done by analysing currently offered models of electric vehicles and the announcements made about planned new ones. Logistic growth in the number of available makes with BEV or REEV/PHEV drives is then determined on this basis using ordinary least squares regression. It is also assumed that some buyers decide in favour of an EV of a different brand (if an EV has ideal TCO) and the rest for a conventional vehicle of the original brand. The most important factors obstructing market diffusion of electric vehicles are taken into account with the economic efficiency, range anxiety and limited offer of electric vehicles.
The fourth and final step then integrates other aspects of electric vehicles, which tend to support their market penetration, for example environmental friendliness, low noise emissions or the allure of an innovative technology. These supportive aspects are integrated in the model for private users via the willingness to pay more. Experience shows that the admission of a willingness to pay a higher price in questionnaires is not the same as actually observed purchasing behaviour. Nevertheless, it does provide first indications of the esteem attached to new technologies and the approximate magnitude of the willingness to pay more for them. The approach of taking the willingness to pay a higher price is a common one in market diffusion models of AFVs.
In this final step, the market evolution is modelled for AFV in Germany up to 2050. The driving profiles at which an AFV becomes economically viable are determined for each year based on the analyses conducted. The evolution of the market is then determined by extrapolating the share of these users in newly registered vehicles. Monetary policy measures are also integrated into the model such as purchase bonuses, for example, and their impacts on the evolution of the market are quantified.
Passenger Cars outside of Germany
The market diffusion of passenger cars in Europe is based on the projected diffusion in Germany and combined with country specific factors. We fit logistic functions to model-based predictions for Germany, for the period 2017-2030 and transfer them to the other European countries with modifications according to the national electricity and gasoline price ratio. The basic rationale is to use current market shares as starting point and modify the logistic market diffusion according to national conditions. These conditions, when expressed in savings per kilometre between conventional and PEVs, vary between €0.03 and €0.08 per km (between countries that combine less electricity prices with high gasoline prices or vice versa). These country specific fuel savings are used to set the growth parameter of a logistic diffusion curve. The second parameter of the diffusion curve, the time with 50% market diffusion, is set such that the logistic market diffusion curve meets the countries 2016 PEV sales share. We thus arrive at country specific logistic market diffusion curves of PEV that are projected until 2050.
Heavy-duty vehicles
We calculate sales and stock for AFV heavy duty vehicles until 2030 for Germany and extrapolate market shares until 2050. The reason for the extrapolation is that the extrapolation of market shares provides higher certainty than extrapolating the forecasts for individual parameters in long-term forecasts. The calculated market shares are considered equal in all other European countries as we assume a coordinated European infrastructure ramp up and heavy road transport is to a large extent trans-national in Europe. For catenary hybrid trucks, the share of electric driving with trolley trucks depends on the share of highways with overhead lines and the annual driving distance of the truck (the average share of km on the highway increases with annual vehicle km travelled). We assume that connected highway segments with the highest heavy-duty traffic will be electrified first. In many cases, the distribution of highway traffic is right skewed. Accordingly, the relation between the share of electrified vehicle kilometres and electrified highway kilometres is modelled mathematically.
Input Data
The driving profiles of vehicles form a very important foundation for the calculations. A separate database (“REM2030-Fahrprofile”) is used for commercial traffic (fleet users) and the so called “Mobility Panel” for private and company car users (MOP), which also contains information about the driver that can be used to distinguish private users with privately owned vehicles from those with a company car. The driving data only covers Germany, but general driving patterns do not vary much within Europe, only the total distance travelled (in million passenger km or average annual of vehicle kilometres travelled). The influence of the charging infrastructure can also be modelled to a certain extent using the driving profiles, because the driving profiles of the mobility panel contain information about the trips made. As already discussed, no spatially resolved modelling is done. A willingness to pay more is assigned to each individual private driving profile according to the affiliation to one of four groups in the innovation process. Based on a cross-comparison of the different studies, it is assumed that 55% of commercial users are not willing to pay more. The other 45% have a willingness to pay 10% more on the so-called Full Leasing Rate. In the market evolution model, this is translated as an extra 7% on top of the purchase price of the conventional reference model. Overall, the assumptions about the willingness to pay more are rather cautious compared to the statements made in the underlying studies. As already stated, company car users are assumed not willing to pay more. In ALADIN, only 1.5% of the driving profiles are assigned a willingness to pay of more than 10%, and approximately half of the private driving profiles are given a low willingness to pay 1% more. The willingness to pay more is assumed to decrease to 60% by 2020 and further thereafter for both private and commercial users, because novel technologies become less attractive over time.
Driving date for medium and heavy-duty vehicles is taken from the large-scale commercial vehicle survey KiD 2010 for Germany. It is enriched with transport performance and annual mileage data from EUROSTAT.
Model coverage
Geographical, temporal, and segment coverage
The ALADIN model covers Germany and Europe (individual EU28 countries as well as Switzerland and Norway). It simulates the market diffusion of AFVs from 2011 until 2050. Focus of the analysis are passenger cars, as well as light-duty, medium-duty and heavy-duty vehicles. Additional model runs cover the US, China, and India.
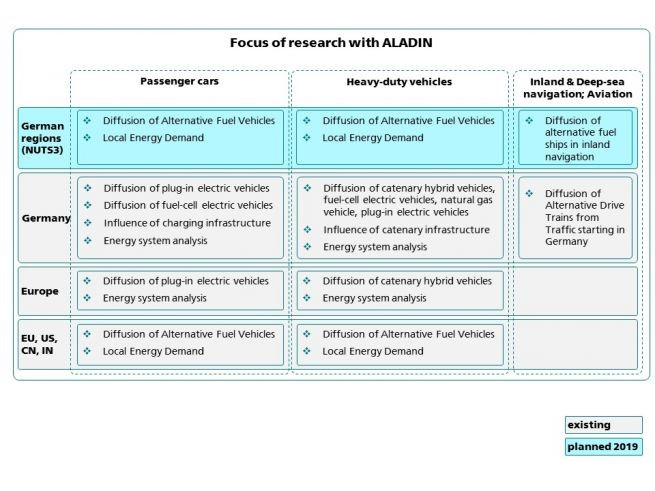
Coverage of the ALADIN model
Mitigation options
The model covers the PEV, BEV, PHEV, REEV, CNG, and FCEV as mitigation options in road transport for passenger cars. The model can incorporate the change in energy, vehicle, or battery prices directly. Changes in general car usage or purchase, such as the increased usage of car sharing, must be integrated as changes in total passenger car sales. Furthermore, modal shifts can be integrated indirectly too, e.g. as reduction in annual mileage of the vehicles or lower total number of vehicles sold. One strength of the model is that an increased availability of public charging infrastructure can be directly modelled.
For medium and heavy-duty vehicles, the ALADIN model covers BEV, PHEV, FCEV, and catenary hybrid trucks as mitigation technologies. An increase in charging or refuelling infrastructure can be directly modelled in ALADIN, whereas a total change in freight activity must be incorporated as reduced vehicles sales or change in annual mileage.
Specific modelling for PARIS REINFORCE
With help of the ALADIN model, the PARIS REINFORCE project will analyse the following transport specific aspects in Paris Reinforce:
- electrification strategies for passenger cars and heavy-duty vehicles;
- infrastructure evolution for refuelling/recharging of AFVs;
- policies targeting AFV investment decisions;
- real-life behaviour and modal shift; and
- comparisons between electrification in road transport and the introduction of synthetic fuels in air and water transport.
Recent publications using the ALADIN model
| Paper | Topic | Key findings | Linkage with other modelling tools |
|---|---|---|---|
| Gnann et al., 2019 | Effect of slow charging infrastructure on PEV sales | How much public charging infrastructure for PEVs is needed and is there mutual interaction in the diffusion of public charging infrastructure and electric vehicles? The paper demonstrates the possibility of a market diffusion in Germany without any slow public charging infrastructure until 2030. Although a charging point at home is obligatory for early adopters, the second-best option for an infrastructure set-up is at work where the majority of vehicles is parked for a long time during the day, installation is not costly and users profit more than from public facilities. | No |
| Plötz et al., 2019 | Impact of Catenary trucks on energy system | Market diffusion scenarios of electric trucks in Europe are studied, while covering CO2 emissions from trucks in the transport and energy sector. We introduce load curves for trolley trucks and run a complete energy system analysis including trolley trucks. We find that electric trucks can reduce CO2 emissions from the transport and energy sector even when no additional renewable capacity is installed. | Yes (with the energy system model PERSEUS-EU) |
| Gnann et al., 2018 | Load shifting and RES integration potential of electric vehicles | We model the market diffusion of electric vehicles and their load shifting potential. We analyze private and commercial PEVs in Germany in 2030 with 50% renewables. Commercial electric passenger cars charge different to private ones. We find large load shifting potentials if charging at home and at work is possible. 25–30% more excess renewable electricity can be integrated with PEV load shifting. | Yes |
| Gnann, 2015 | Market diffusion of electric vehicles and their charging infrastructure | Analysis of electric vehicles market diffusion scenarios in Germany until 2030 and interaction with public charging infrastructure roll-out. We find that there is no chicken-egg-problem for charging infrastructure for electric vehicles in western Europe as most users can easily charge at home. Furthermore, additional public slow charging infrastructure has hardly any effect on electric vehicle sales | No |
| Kluschke et al., under review) | Market diffusion of Fuel cell trucks in Germany and optimal H2 fuel station network | The paper describes market diffusion scenarios for FCEV trucks in Germany. It develops a model for the optimal siting and number of the refueling network with capacity limits as important property of hydrogen fuel stations. We find about 160 – 350 Hydrogen refeuling stations to cover heavy-duty highway transport in Germany. A capacity limit per station increases the number of stations required and changes their optimal location. | Yes |
References
Gnann, T., Plötz, P., & Wietschel, M. (2019). Can public slow charging accelerate plug-in electric vehicle sales? A simulation of charging infrastructure usage and its impact on plug-in electric vehicle sales for Germany. International Journal of Sustainable Transportation, 13, 528-542. doi:10.1080/15568318.2018.1489016
Plötz, P., Gnann, T., Jochem, P., Yilmaz, H. Ü., & Kaschub, T. (2019). Impact of electric trucks powered by overhead lines on the European electricity system and CO2 emissions. Energy Policy, 130, 32-40. doi:10.1016/j.enpol.2019.03.042
Gnann, T., Klingler, A.-L., & Kühnbach, M. (2018). The load shift potential of plug-in electric vehicles with different amounts of charging infrastructure. Journal of Power Sources, 390, 20-29. doi:10.1016/j.jpowsour.2018.04.029d
Gnann, T. (2015). Market diffusion of plug-in electric vehicles and their charging infrastructure. Ph.D. dissertation, Karlsruhe, Inst. für Technologie (KIT).
Kluschke, P., Nugroho, R., Gnann, P. P., Wietschel, M., & Reuter-Oppermann, M. (Under review). Optimal development of alternative fuel station networks considering node capacity restrictions. Transportation Research Part D: Transport and Environment.
